
Fig. 3
- ID
- ZDB-IMAGE-260709-55
- Publication
- Valtorta et al., 2026 - Unprocessed U1 snRNAs as a biomarker of INTS11- and BRAT1-related neurodevelopmental disorders
- All Figures
- Figures for Valtorta et al., 2026
|
Fig. 3
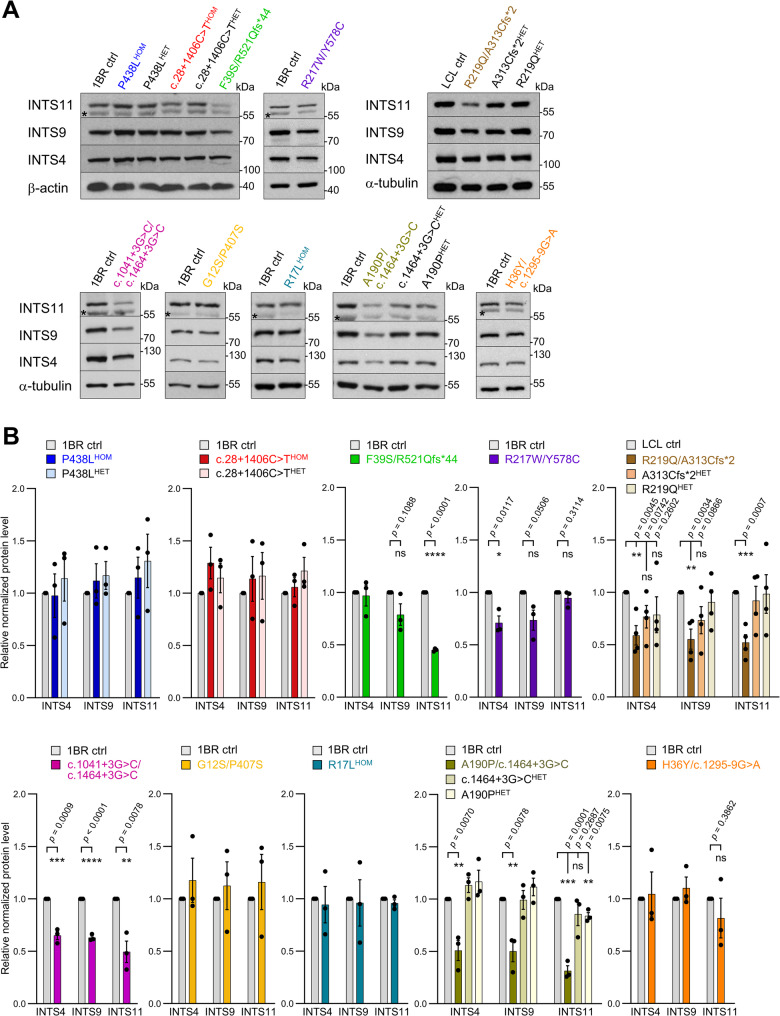
Analysis of Integrator subunit protein levels in INTS11-mutated patient-derived cells. A Immunoblot analysis of INTS11, INTS9, and INTS4 protein levels in fibroblasts and lymphoblastoid cell lines (LCLs) derived from the healthy control, unaffected parents or INTS11-mutated patients. β-actin or α-tubulin was used as a loading control. A non-specific band is indicated by an asterisk (*). B Quantification of protein levels from (A), based on at least three independent experiments. Data are presented as mean ± SEM. Statistical significance was determined using a two-tailed Student’s t-test (ns – not significant, *p < 0.05, **p < 0.01, ***p < 0.001, ****p < 0.0001)