
Fig. S1
- ID
- ZDB-IMAGE-260618-7
- Publication
- Biswas et al., 2026 - Canalization of neural dynamics by δ-protocadherins in the developing zebrafish optic tectum
- All Figures
- Figures for Biswas et al., 2026
|
Fig. S1
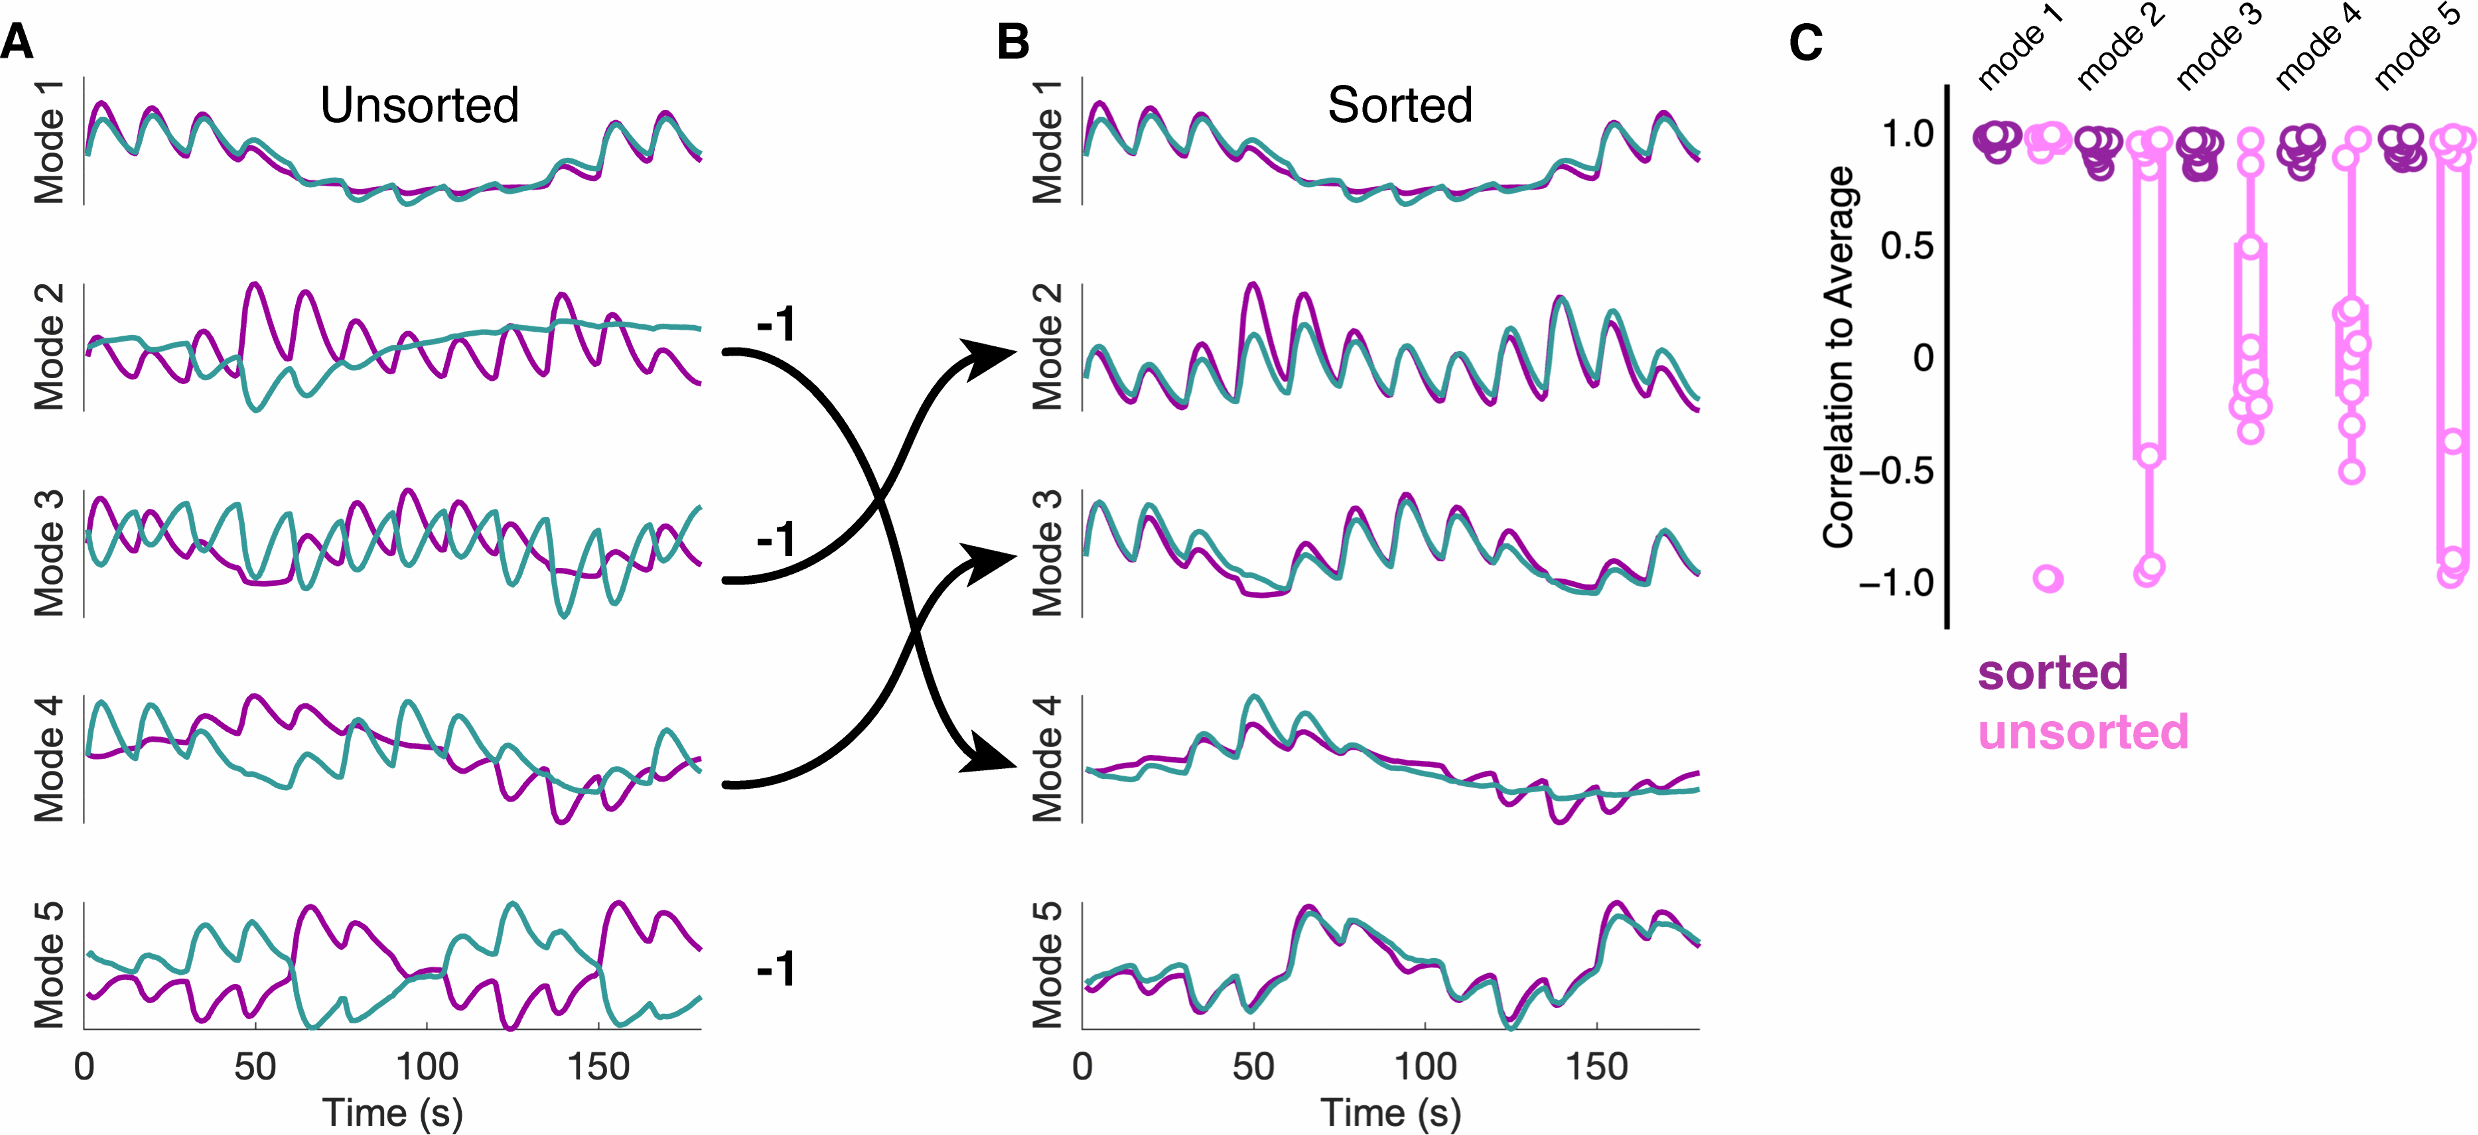
Ordering and alignment of dynamics.
A,C Shown are reference dynamics along each mode (purple), and the dynamics in which neuronal responses from an individual larva were projected onto the first five neural modes obtained by PCA (teal). Apart from mode 1, the dynamics appear uncorrelated. However, the same patterns are present, but their relative order and sign differ. The order of modes varies due to variation in the relative importance of the principal components, and the sign varies, due to the chosen direction of the principal component when the neuronal responses are projected onto the axes. B. The dynamics can be sorted, so that each neural mode represents the same dynamics among the different fish (c). This includes adjusting the order of neural modes (arrows), as well as the sign (-1). Sorting is done by maximizing the correlation coefficients, r, for each neural mode. C Sorting the dynamics improves correlations, as only like neural modes are being averaged and compared.