
|
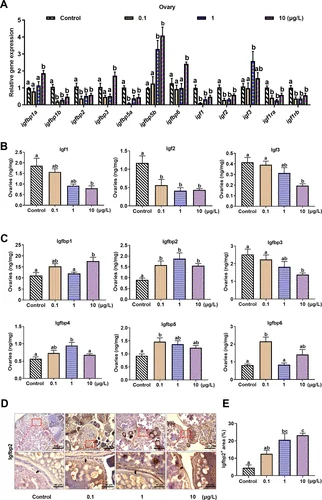
Fig. 6 mRNA and protein levels of molecules associated with growth factor activity in WT female zebrafish ovaries after 150-day exposure to neburon. (A) The mRNA expression of insulin-like growth factors (igfs)-related genes in ovaries (n = 6 samples/group). (B) The protein expression of Igf1, Igf2 and Igf3 detected in ovaries by ELISA (n = 4 samples/group). (C) The protein expression of insulin-like growth factor binding protein 1 (Igfbp1), Igfbp2, Igfbp3, Igfbp4, Igfbp5, and Igfbp6 detected in ovaries by ELISA (n = 4 samples/group). (D) The representative ovarian sections were labeled with Igfbp2 using immunostaining. Areas in brown indicated positive staining signal. The positive signal area was magnified in the lower panel, and the granulosa cells were indicated by the arrow. (E) The proportion of Igfbp2-positive (Igfbp2+) area to total follicles area in ovarian sections (n = 3 samples/group). Scale bars, 200 μm (top panel) and 40 μm (bottom panel). Data are presented as the mean ± SE. Statistical analysis was performed using one-way analysis of variance (ANOVA) followed by posthoc Duncan’s test. Different letters on the bars represent statistically significant differences at p < 0.05 between groups. The data presented in Figure 6A,B,C,E are also displayed in Excel Table S23, S24, S25 and S26, respectively.