
|
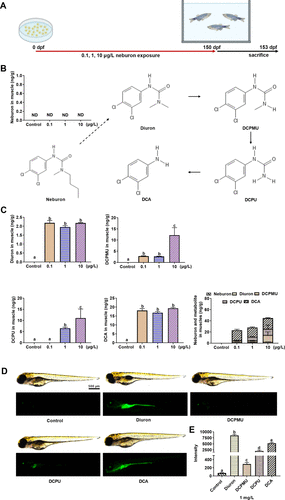
Fig. 1 Metabolites were identified after neburon exposure in WT female zebrafish and their aryl hydrocarbon receptor (AHR) agonistic activity was examined using Tg(cyp1a-12DRE:EGFP) zebrafish. (A) Scheme of neburon exposure. (B) The contents of neburon in muscle of zebrafish exposed for 150 days (n = 3 samples/group), and the putative metabolic pathways of neburon. (C) The contents of diuron, 3-(3,4-dichlorophenyl)-1-methylurea (DCPMU), 3,4-dichlorophenylurea (DCPU), and 3,4-dichloroaniline (DCA) in muscle and the proportion of neburon and its metabolites in muscle (n = 3 samples/group). (D) The typical images of Tg(cyp1a-12DRE:EGFP) zebrafish larvae after treatment with diuron, DCPMU, DCPU, and DCA. The image exposure time: 200 ms. Scale bar = 500 μm. (E) The fluorescence density values of Tg(cyp1a-12DRE:EGFP) zebrafish larvae after treatment with diuron, DCPMU, DCPU, and DCA (n = 8 samples/group). Data are presented as the mean ± standard error (SE). Statistical analysis was performed using one-way analysis of variance (ANOVA) followed by posthoc Duncan’s test. Different letters on the bars represent statistically significant differences at p < 0.05 between groups. The data presented in Figure 1B,C,E are also displayed in Excel Table S6, S7, and S8, respectively.