
Figure 5.
- ID
- ZDB-IMAGE-260530-40
- Publication
- Pirzada et al., 2026 - Loss of U11/U12 spliceosome gene ZCRB1 leads to aberrant ciliogenesis and WNT signaling
- All Figures
- Figures for Pirzada et al., 2026
|
Figure 5.
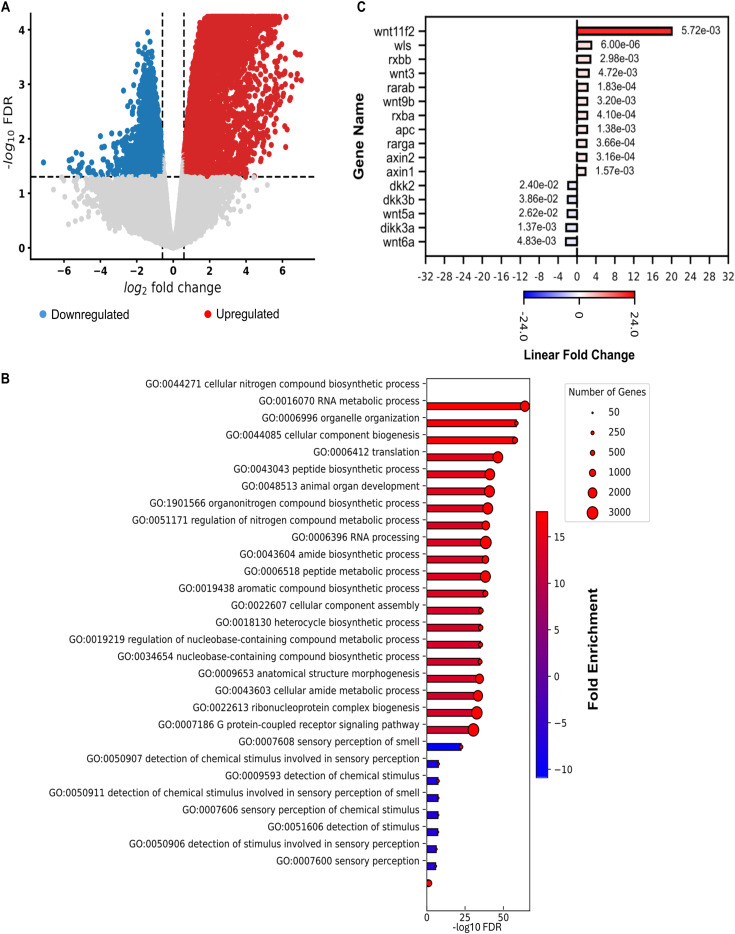
Wnt signaling up-regulation after loss of zcrb1 is conserved in zebrafish.
(A) Volcano plot showing DE genes identified by RNA sequencing between 24 hpf zcrb1 crispant embryos and Cas12a control–injected embryos. The red and blue dots denote significantly up-regulated and down-regulated genes, respectively, whereas the gray dots denote genes showing no significant change. The vertical dashed lines represent the cutoff for significant fold change (≥ absolute log2 fold change of 0.58), whereas the horizontal line signifies the FDR significance cutoff (≤0.05). (B) Bar plot representing the top enriched biological processes (BP) identified in zcrb1 crispant embryos versus Cas12a control–injected embryos. The length of bars is proportional to the FDR (adjusted P-value), and the bar color represents the degree of linear fold change. The size of the red dot on the end of the bars represents the number of genes present in each identified enriched pathway. (C) Bar plot representation of the top DE Wnt signaling pathway genes (FDR ≤ 0.05 and linear fold change ≥ 1.5) as identified by RNA-sequencing analysis between zcrb1 crispant embryos and Cas12a control–injected embryos. Red and blue bars represent up-regulated and down-regulated linear fold changes, respectively. The bar color intensity reflects the degree of gene expression change. The FDR values for genes are displayed next to their respective bars.