
Figure 4.
- ID
- ZDB-IMAGE-260530-34
- Genes
- Publication
- Pirzada et al., 2026 - Loss of U11/U12 spliceosome gene ZCRB1 leads to aberrant ciliogenesis and WNT signaling
- All Figures
- Figures for Pirzada et al., 2026
|
Figure 4.
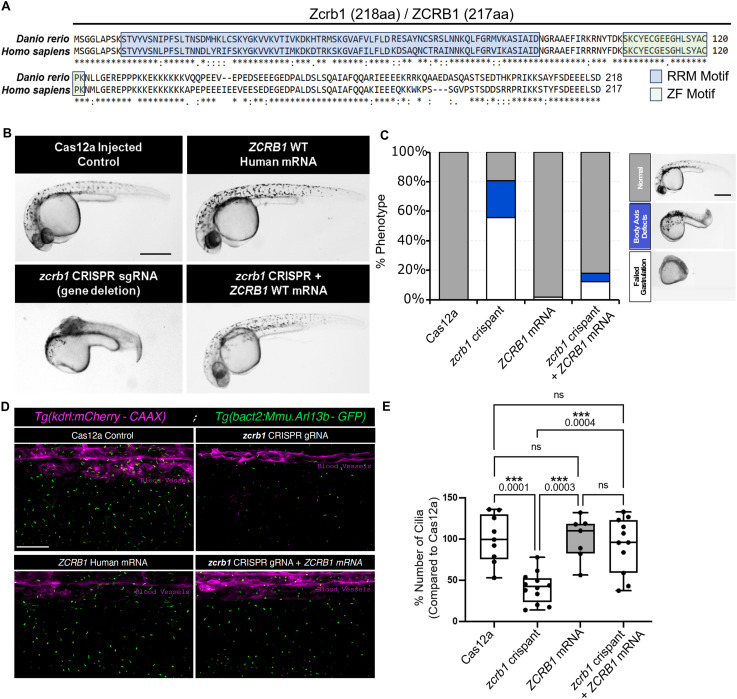
zcrb1 is essential for development and primary ciliogenesis in zebrafish.
(A) Alignment of the ZCRB1 amino acid sequence from human versus zebrafish. * represents exact homology. (B) Representative phenotypes associated with zcrb1 CRISPR-Cas12a F0 crispant zebrafish embryos (CRISPR sgRNA) compared with Cas12a control–injected embryos, ZCRB1 WT human mRNA–injected embryos, and zcrb1 crispants plus ZCRB1 WT human mRNA–injected embryos (rescue condition) (scale bar: 500 μm). (C) Stacked bar plot represents the percentage of phenotypes shown in Cas12a-injected embryos, zcrb1 crispant–injected embryos, Cas12a embryos injected with ZCRB1 WT human mRNA, and zcrb1 crispant embryos co-injected with ZCRB1 WT human mRNA. Quantification shows a phenotypic rescue of zcrb1 crispants after re-introduction of ZCRB1 WT human mRNA. n > 20 embryos per condition. A minimum of three independent rounds of injection were analyzed (scale bar: 500 μm). (D) Representative image of cilia using the Tg(actb2:Mmu.Arl13b-GFP)hsc5Tg transgenic zebrafish across Cas12a-injected embryos, zcrb1 crispant–injected embryos, Cas12a embryos injected with ZCRB1 WT human mRNA, and zcrb1 crispant embryos co-injected with ZCRB1 WT human mRNA. Cilia are shown in green; blood vessels are labeled in magenta and were used to determine consistent imaging localization (scale bar: 100 μm). (E) Quantification of the percent number of primary cilia between Cas12a-injected embryos, zcrb1 crispant–injected embryos, Cas12a embryos injected with ZCRB1 WT human mRNA, and zcrb1 crispant embryos co-injected with ZCRB1 WT human mRNA. All conditions are a percentage of the Cas12a control condition. Graphs are box plots with min/max error bars. P-values were measured by an ordinary one-way ANOVA with Tukey’s multiple comparisons test. Dots represent individual embryos per condition. A minimum of two independent rounds of injection were analyzed.