
Figure 7
- ID
- ZDB-IMAGE-260530-220
- Publication
- Mencacci et al., 2026 - Pathogenic variants in BORCS5 Cause a Spectrum of Neurodevelopmental and Neurodegenerative Disorders with Lysosomal Dysfunction
- All Figures
- Figures for Mencacci et al., 2026
|
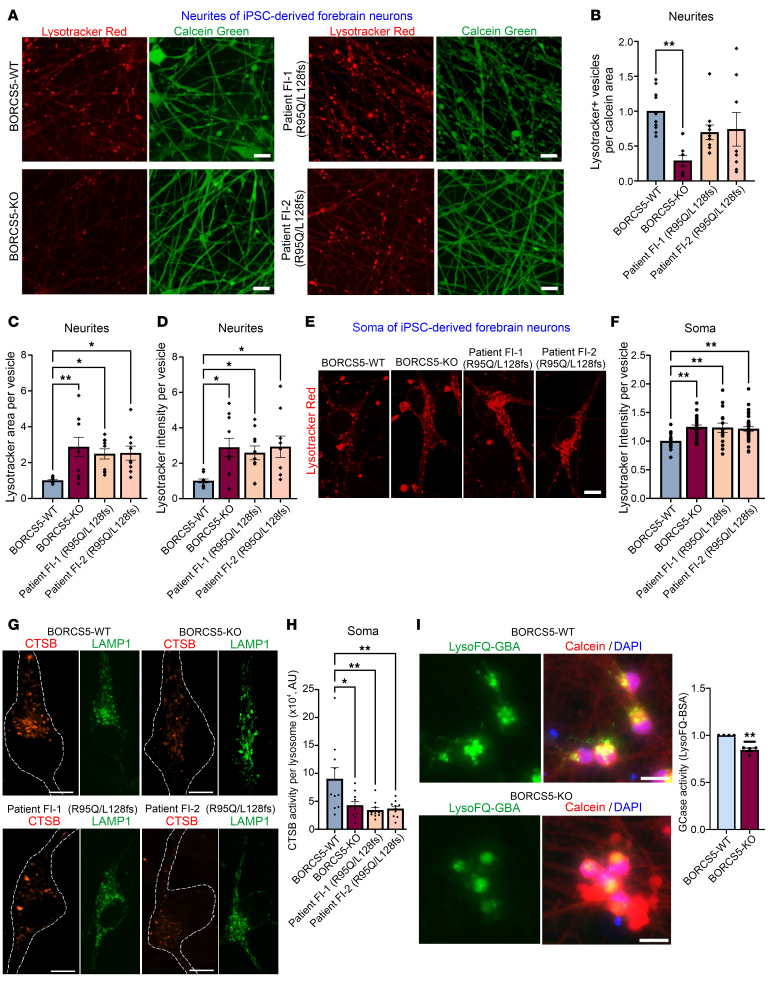
Figure 7 Lysosome-dispersal activity of patient-specific BORCS5 variants. Increased LysoTracker and decreased lysosomal enzyme activity in neurons with patient-specific BORCS5 variants. (A) Imaging of Lysotracker Red signal (red) in neurites of live iPSC-derived forebrain neurons (labeled with calcein, green) from WT, isogenic BORCS5-KO, or R95Q/L128fs patient iPSC lines. Scale bar: 10 μm. (B–D) Graphs show the mean ± SEM of 3 independent experiments. For vesicle number, 1-way ANOVA with Dunnett’s post-hoc test F(3,34) = 5.250 (P = 0.0044); for vesicle area, F(3,35) = 5.373 (P = 0.0038); for signal intensity, F(3,35) = 4.362 (P = 0.0104). (E) Imaging of Lysotracker Red endolysosomes (red) in the soma of iPSC-derived forebrain neurons from the indicated lines. Scale bar: 10 μm. (F) The graph shows the mean ± SEM of 3 independent experiments. For signal intensity, 1-way ANOVA with Dunnett’s post hoc test F(3,87) = 5.624 (P = 0.0014). (G) Fluorescence microscopy examination of LAMP1+ stained endolysosomes (green) and cathepsin B (CTSB) activity–derived fluorescent signal (red) in the soma of iPSC-derived forebrain neurons from the indicated lines. Scale bar: 10 μm. (H) The graph shows the mean ± SEM of 3 independent experiments. For CTSB activity soma, 1-way ANOVA with Dunnett’s post hoc test F(3,36) = 5.478 (P = 0.00333). Dots represent individual cells. Scale bar: 10 μm. (I) Fluorescence microscopy shows viable (calcein; red) day 21 iNeurons upon uptake of the lysosomal GCase substrate LysoFQ-GBA (green) and counterstained with DAPI. Scale bar: 50 μm. The lysosomal GCase activity–dependent fluorescent signal was quantified, and the graph shows the mean ± SEM of the relative intensity over mean WT within a specific experiment (n = 4 independent experiments). One-sample t test. **P = 0.0042.