
Figure 6
- ID
- ZDB-IMAGE-260530-219
- Publication
- Mencacci et al., 2026 - Pathogenic variants in BORCS5 Cause a Spectrum of Neurodevelopmental and Neurodegenerative Disorders with Lysosomal Dysfunction
- All Figures
- Figures for Mencacci et al., 2026
|
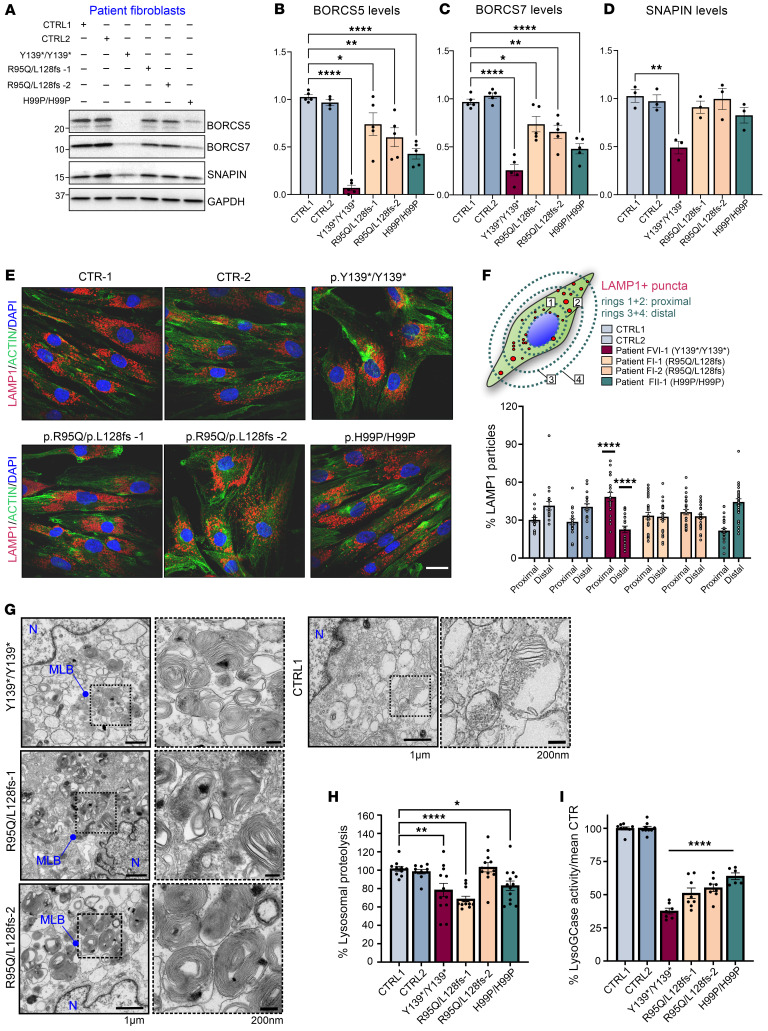
Figure 6 BORC-related protein expression, endolysosomal distribution, and function in fibroblasts of patients with BORCS5 pathogenic variants or 2 independent control lines. (A) Western blot analysis of proteins BORCS5, SNAPIN, and BORCS7; GAPDH was used as a loading control. (B–D) Graphs represent mean ± SEM of 3–5 independent experiments. For BORCS5, 1-way ANOVA with Dunnett’s post hoc test (compared with control 1 [CTRL1]), F(5,23) = 24.56 (P < 0.0001; for BORCS7, F(5,24) = 27.02 (P < 0.0001); and for SNAPIN, F(5,12) = 6.704 (P = 0.0034). *P < 0.03, **P < 0.003, ****P < 0.0001. (E) Immunofluorescence microscopy shows endogenous LAMP1 puncta distribution. Scale bar: 25 μm. (F) Schematic shows the analysis of LAMP1+ puncta distribution in fibroblasts, using elliptical concentric rings of 1.5 increments from the nucleus (ring 1 outlined). Puncta within rings 1 and 2 were designated “proximal” to the nucleus, and those between rings 3 and 4 were designated “distal.” The graph represents the mean ± SEM from 3 independent experiments, each dot representing a different cell. For the interaction, 2-way ANOVA F(5,276) = 22.86 (P < 0.0001), with Tukey’s post hoc test (compared with CTRL1/CTRL2). (G) TEM micrographs of BORCS5 patient or control fibroblasts, with dashed lines indicating magnification of the outlined insets. MLB, multilamellar body; N, nucleus. (H) Lysosomal proteolysis efficiency was assessed upon administration of 25 μg/mL of DQ Green or Red BSA for 5 hours, in 10,000 single-cell events, via flow cytometry. The graph represents the mean ± SEM of the percent median fluorescence intensity, normalized to the mean of control lines (n = 8–9 independent experiments). For proteolysis, 1-way ANOVA with Dunnett’s post hoc test (compared with CTRL1), F(5,63) = 8.687 (P < 0.0001). *P = 0.038, **P = 0.007, ****P < 0.0001. (I) Lysosomal GCase activity was assessed upon administration of 250 μM PFB-FDGlu for 30 minutes, in 10,000 single-cell events, via flow cytometry. The graph represents the mean ± SEM of the percent median fluorescence intensity, normalized to the mean of control lines. CTR-1/CTR-2, n = 7; p.Y139*/p.Y139* and p.R95Q/L128Vfs*86, n = 4; p.H99P/H99P, n = 3 independent experiments. For lysoGCase, 1-way ANOVA with Dunnett’s post hoc test (compared with CTRL1), F(5,41) = 121.3 (P < 0.0001). ****P < 0.0001.