
Figure 4
- ID
- ZDB-IMAGE-260530-215
- Antibodies
- Publication
- Mencacci et al., 2026 - Pathogenic variants in BORCS5 Cause a Spectrum of Neurodevelopmental and Neurodegenerative Disorders with Lysosomal Dysfunction
- All Figures
- Figures for Mencacci et al., 2026
|
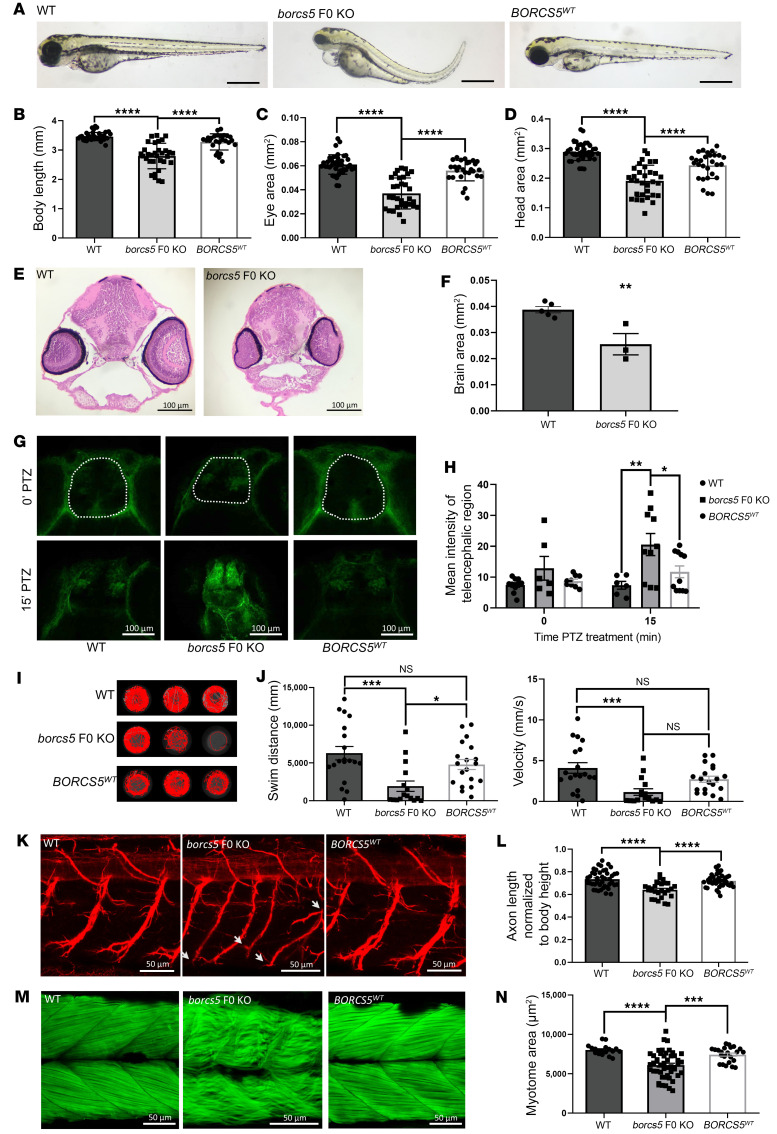
Figure 4 Zebrafish borcs5-ko larvae exhibit developmental defects and recapitulate patient symptoms. (A) Morphology of WT borcs5-ko and BORCS5WT-rescued larvae at 3 dpf. Scale bars: 500 μm. (B–D) Quantification of body length (B), eye size (C), and head size (D) in WT (n = 3, n = 40), borcs5-ko (n = 3, n = 32) and BORCS5WT (N = 3, n = 26–28) 3 dpf larvae. (Note n represents number of fish; N represents number of experimental repeats with each repeat consisting of embryos or larvae pooled from 3 independent clutches from different mating pairs.) (E) H&E staining of midbrain sections from 3 dpf WT and borcs5-ko larvae. Scale bar: 100 μm. (F) Quantification of brain area in WT (N = 5) and borcs5-ko 3 dpf (N = 3) larvae. (G and H) Neuronal activity assessed by p-MAPK/ERK fluorescence intensity in 4-dpf larvae after PTZ treatment (3 mM; 0 or 15 minutes). borcs5-ko (N = 2, n = 6–10) larvae showed significantly increased activity compared with WT (N = 2, n = 6–10) and BORCS5WT (N = 2, n = 9–11). Scale bars: 100 μm. (I) Representative swim trajectories of WT, borcs5-ko, and BORCS5WT larvae at 5 dpf. (J) Quantification of swim distance and velocity in WT (N = 1, n = 19), borcs5-ko (N = 1, n = 16), and BORCS5WT (N = 1, n = 19). (K) Acetyl tubulin staining of primary motor axon at 3 dpf. White arrows indicate axon branching defects in borcs5-ko larvae. Scale bars: 50 μm. (L) Axon length normalized by body height in WT (N = 2, n = 10), borcs5-ko (N = 2, n = 6), and BORCS5WT (N = 2, n = 10). (M) Phalloidin staining of muscle fibers at 3 dpf. Scale bars: 50 μm. (N) Quantification of dorsal or ventral myotome area in WT (N = 2, n = 9), borcs5-ko (N = 2, n = 10) and BORCS5WT larvae (N = 2, n = 12). Data are given as mean ± SEM. Statistical significance was calculated by 1-way ANOVA followed by Tukey’s multiple comparisons test (B–D, H, J, L, N), or Student’s t test (F). *P < 0.05; **P < 0.01; ***P < 0.001; ****P < 0.0001.