IMAGE

Figure 11

ID
ZDB-IMAGE-260530-157
Source
Figures for Liu et al., 2026
Image
Figure Caption

Figure 11

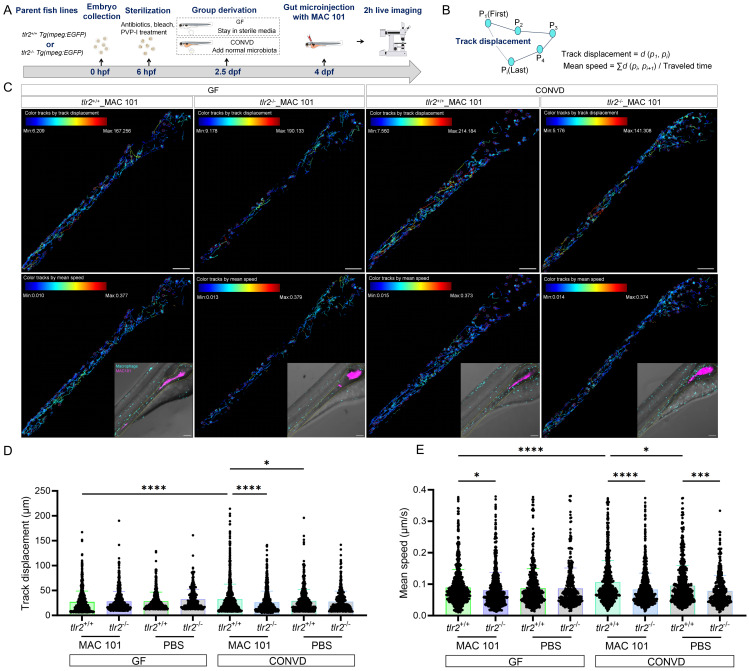
TLR2 deficiency impairs macrophage motility after robotic MAC 101 gut microinjection. (A) Schematic of the experimental workflow. (B) Calculation formulas of track displacement and mean speed. (C) Representative images showing trajectories of macrophages at the gut region in tlr2 wild-type and mutant larvae under CONVD and GF conditions. (D) Track displacement of macrophages. (E) Mean speed of macrophages. The data from GF tlr2+/+ (n=3) group, GF tlr2-/- (n=3) group, CONVD tlr2+/+ (n=3) group and CONVD tlr2-/- (n=3) group are based on three independent experiments (one larva for each group per independent experiment). Statistical significant difference was determined by one-way ANOVA, red arrows point to the median, ns, non-significant, *, P < 0.05, ***, P < 0.001, ****, P < 0.0001.

Acknowledgments
This image is the copyrighted work of the attributed author or publisher, and ZFIN has permission only to display this image to its users. Additional permissions should be obtained from the applicable author or publisher of the image. Full text @ Int. J. Biol. Sci.