
Image
|
Figure Caption
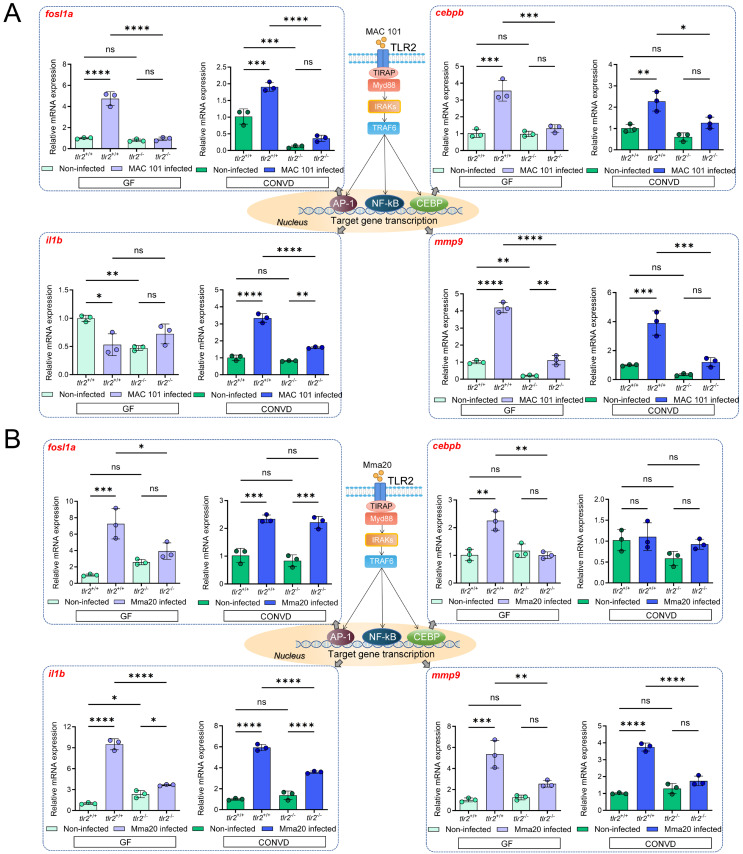
Figure 4
Immune-related gene expression profiles after MAC 101 and Mma20 immersion infection. (A) Immune-related gene expression profiles after MAC 101 immersion infection. (B) Immune-related gene expression profiles after Mma20 immersion infection. Statistical significant difference was determined by one-way ANOVA, ns, non-significant, *,
Acknowledgments
This image is the copyrighted work of the attributed author or publisher, and
ZFIN has permission only to display this image to its users.
Additional permissions should be obtained from the applicable author or publisher of the image.
Full text @ Int. J. Biol. Sci.