
Fig. 2
- ID
- ZDB-IMAGE-260529-62
- Antibodies
- Publication
- Bai et al., 2026 - Macrophages warrant Mauthner cell axon regrowth by preventing late-stage hyperglycemia in zebrafish
- All Figures
- Figures for Bai et al., 2026
|
Fig. 2
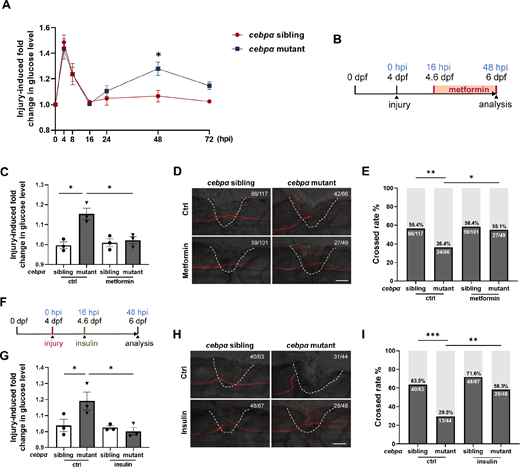
Suppression of the late-stage glucose elevation rescues defective M-cell axonal regeneration in myeloid cell-deficient mutants. (A) Relative glucose levels in the injured group compared to the uninjured group at different time points post-injury in cebpα siblings and mutants. Differences in relative glucose levels between cebpα siblings and mutants were analysed by two-way ANOVA. Error bars indicate means ± s.e.m. (B,F) Schematic of metformin treatment (B) or insulin injection (F). (C,G) Relative glucose levels at 48 hpi in the injured group compared to the uninjured group after metformin treatment (C) or insulin/E2 injection (G) in cebpα siblings and mutants. These graphs combine data from three biological replicates. Data were analysed by two-way ANOVA. Error bars represent means ± s.e.m. (D,H) Representative images of M-cells at 48 hpi following metformin treatment (D) or insulin/E2 injection (H). Scale bar = 50 µm. White dashed lines outline the analysed region. (E,I) Quantification of the proportion of larvae with axons successfully crossing the injury site after metformin treatment (E) or insulin/E2 injection (I) in cebpα siblings and mutants. Numbers indicate the ratio of successfully crossed axons to the total number analysed. Data were analysed using the chi-square test. ***p < 0.001; **p < 0.01; *p < 0.05.