
Fig. 6
- ID
- ZDB-IMAGE-260529-19
- Publication
- Tan et al., 2026 - Bi-allelic variants in NDUFA5 cause a mitochondriopathy with complex I deficiency
- All Figures
- Figures for Tan et al., 2026
|
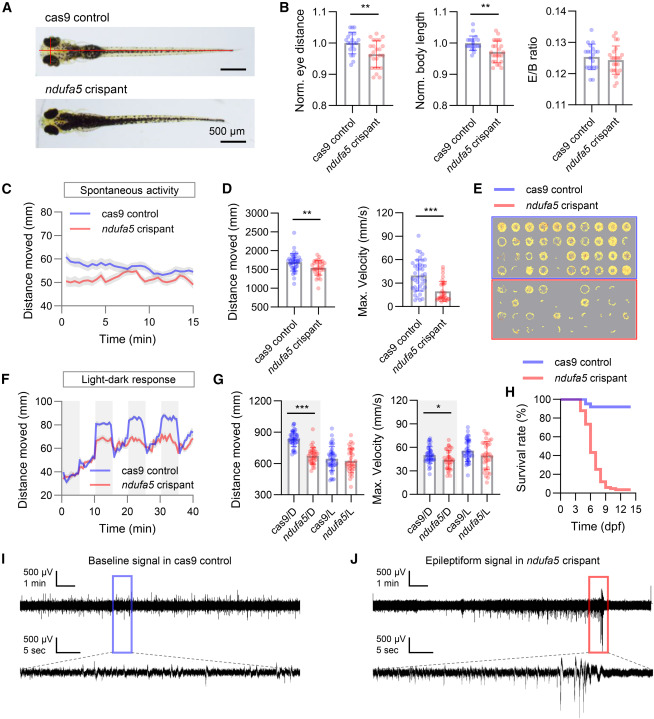
Fig. 6 Disruption of zebrafish ndufa5 results in abnormal embryonic development and neurodevelopmental deficits (A) Representative brightfield images of 5-dpf larval zebrafish (dorsal view). Top: cas9-injected control; bottom: ndufa5 crispant. Red lines denote eye distance and body length. (B) Quantification of eye distance, body length, and eye distance/body length (E/B) ratio in cas9 controls (n = 20 fish) versus ndufa5 crispants (n = 24 fish). Data are normalized to the mean of the cas9 control group. (C) Spontaneous swim activity measured by distance moved for cas9 controls (n = 40 fish) and ndufa5 crispants (n = 31 fish). (D) As for (C) but quantification of total distance moved and maximum velocity. (E) As for (C) but locomotion traces over 15 min of recording. (F) Light-dark evoked response measured by distance moved for cas9 controls (n = 40 fish) and ndufa5 crispants (n = 33 fish); gray blocks indicate dark periods. (G) As for (F) but quantification of total distance moved and maximum velocity across dark-light epochs. (H) Survival curves for cas9 controls (n = 62 fish) and ndufa5 crispants (n = 83 fish). (I) Representative local field potential (LFP) recordings from cas9 controls, showing baseline activity (magnified view below blue box). (J) As for (I) but from ndufa5 crispants, showing epileptiform events (magnified view below red box). Scale bars are indicated in the figure. Error bars represent SEM for distance moved plots and SD for quantification plots. Statistical significance is indicated as ∗p < 0.05, ∗∗p < 0.01, and ∗∗∗p < 0.001.