
Fig. 7
- ID
- ZDB-IMAGE-260526-7
- Publication
- Bastos et al., 2026 - Loss of Cathepsin Z enhances pro-inflammatory macrophage responses and promotes tissue regeneration in zebrafish
- All Figures
- Figures for Bastos et al., 2026
|
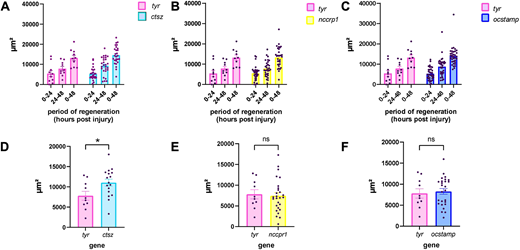
Fig. 7 Regeneration area in crispants for ctsz, nccrp1 and ocstamp genes versus that in tyr control animals. (A-C) Regenerated area in crispants for the ctsz (A), nccrp1 (B) and ocstamp (C) genes versus that in tyr control animals. The normalized regenerated area was calculated for three intervals: regeneration during the first 24 hpi (area at 24 hpi−area at 0 hpi), regeneration during the second 24 hpi (area at 48 hpi−area at 24 hpi) and total regeneration up to 48 hpi (area at 48 hpi−area at 0 hpi). (D) Regeneration area during the second 24 hpi period (area at 48 hpi−area at 24 hpi) of ctsz crispant animals (blue) and tyr control (pink). (E) Regeneration area during the second 24 hpi of nccrp1 crispant animals (yellow) and tyr control (pink). (F) Regeneration area during the second 24 hpi of ocstamp crispant animals (dark blue) and tyr control (pink). In D-F, the analysis was performed in crispants for ctsz (D), nccrp1 (E) and ocstamp (F) genes only where an edit is detectable on a gel, indicating a significant disruption to the gene. Area is expressed in µm², and each point represents a single animal. Two-way ANOVA with Bonferroni multiple comparison test were applied (ns, not significant; *P<0.05); error bars represent mean±s.d.