
|
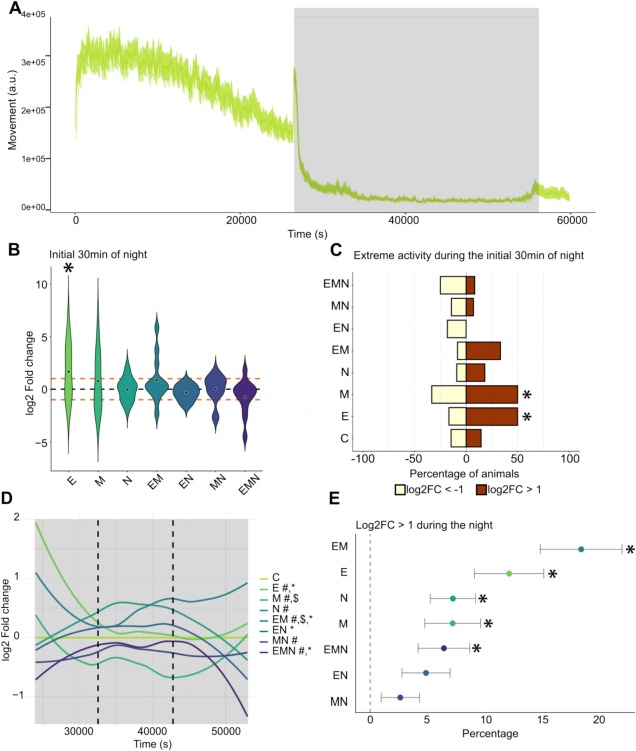
Fig. 5 Sleeping pattern in 14 dpf larvae prenatally exposed. A. Average movement of control larvae across the sleep test protocol. B. Average Log2 fold change relative to controls during the initial 30 min of night. E-exposed larvae showed a significantly increased average log2 fold change in movement. C. Half of E and M groups are hyperactive during the initial 30 min of night. D. Smoothing of the average log2 fold change for each condition during the night. Linear mixed-model analysis was performed for each third of the night independently. In the first third of the observation period, animals exposed to E, M, and EM showed a decrease in log2 fold change, while N, MN, and EMN animals exhibited an increase. Notably, EMN and MN animals were hypoactive and showed a trend toward activity levels similar to the control group. During the second third, the average log2 fold change for both M-exposed animals continued to move toward the control group, whereas animals in the EM group became more hyperactive over time. In the final third, the average log2 fold change increased for animals in the E and EM groups, whereas it decreased for EN and EMN animals. E. The probability of a larva being hyperactive (log2 fold change >1) was calculated across the night, then compared to control animals. The data shown here represent the percentage change in probability relative to the control. Animals from the M-group were almost 20% more likely to be hyperactive than controls. On the other hand, N-exposed larvae showed a reduced probability of being hyperactive. B: * = p < 0.05 compared to controls. Evaluated using mixed-effects models, including Batch as a random effect, followed by Benjamini–Hochberg correction for multiple comparisons. C: * = p < 0.05 compared to control animals. P-values were calculated using Firth's bias-reduced logistic regression to compare each treatment to control, followed by Benjamini–Hochberg correction for multiple comparisons. D: # p < 0.05 during the initial third, $ p < 0.05 during the second third and * p < 0.05 the final third. For each third, the difference is compared to control animals. P-values were obtained using a linear mixed-effects model with condition over time as a fixed effect and subject (larva ID) and Batch as random effects. E: * = p < 0.05 compared to controls. Points show model-estimated probabilities (estimated marginal means; EMMs) on the response scale with 95% confidence intervals. Statistical significance was assessed using EMM contrasts comparing each treatment to the control (treatment-vs-control), reported as differences in predicted probability (Δp). P-values were adjusted for multiple comparisons using the Benjamini–Hochberg procedure. n ≥ 12 per condition.