
Image
|
Figure Caption
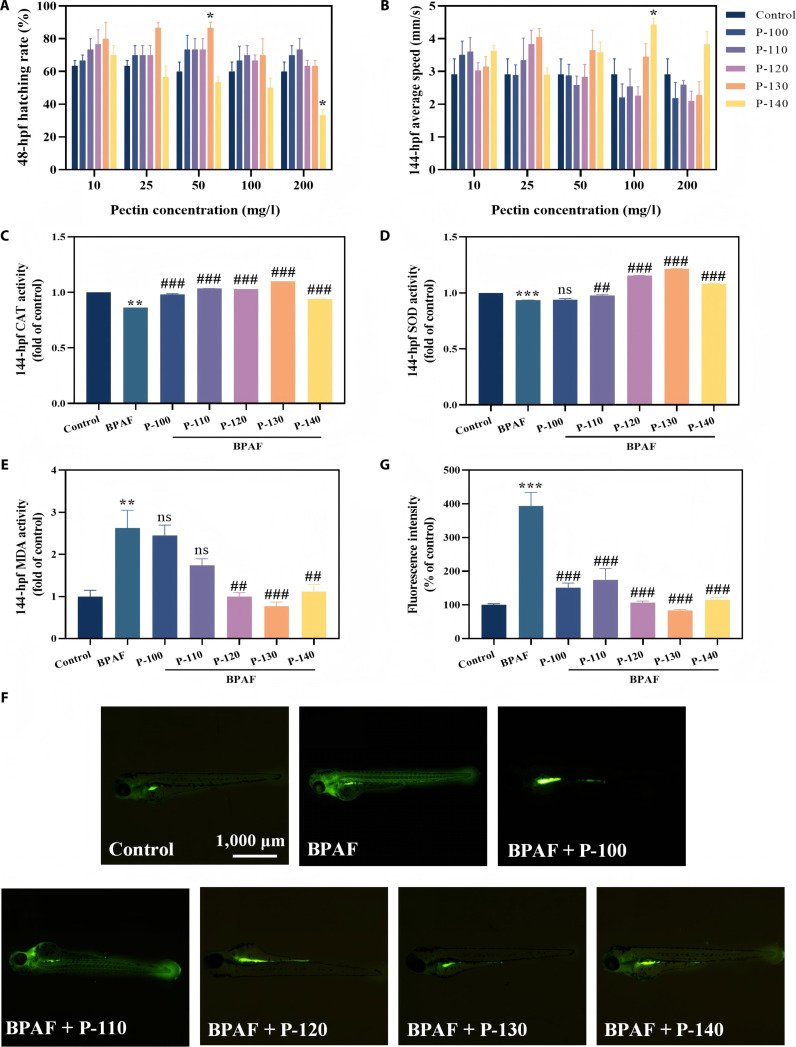
Fig. 2. Effects of different pectin samples on the 48 h postfertilization (hpf) hatching rate (A); average speed at 144 hpf (B); oxidative-stress-related indicators at 144 hpf: catalase (CAT) (C), superoxide dismutase (SOD) (D), and malondialdehyde (MDA) (E); reactive oxygen species (ROS) staining images (F); and ROS fluorescence intensity (G) of zebrafish (*P < 0.05, **P < 0.01, ***P < 0.001, #P < 0.05, ##P < 0.01, and ###P < 0.001; *P is compared with the control group, and #P is compared with the bisphenol AF [BPAF] group).
Acknowledgments
This image is the copyrighted work of the attributed author or publisher, and
ZFIN has permission only to display this image to its users.
Additional permissions should be obtained from the applicable author or publisher of the image.
Full text @ Research (Wash D C)