
Figure 6
- ID
- ZDB-IMAGE-260501-111
- Publication
- De Rycke et al., 2026 - Systematic Disruption of Zebrafish Fibrillin Genes Identifies a Translational Zebrafish Model for Marfan Syndrome
- All Figures
- Figures for De Rycke et al., 2026
|
Figure 6
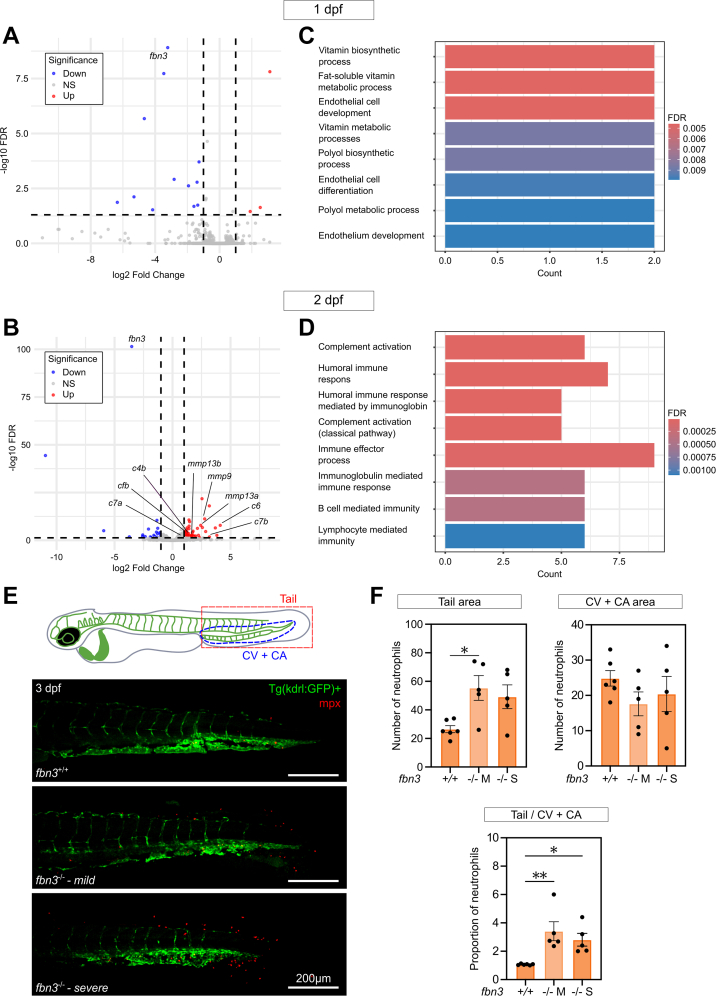
Transcriptomic Analysis of fbn3+/+ and fbn3–/– Siblings at 1 and 2 dpf
(A and B) Volcano plots illustrating differentially expressed genes in fbn3–/– ZF compared with WT siblings at 1 dpf and 2 dpf, respectively. Up-regulated genes are red, and down-regulated genes are blue, with genes of importance annotated. Thresholds: false discovery rate (FDR) ≥0.05 and |log2 fold change| ≥1. (C and D) Gene ontology enrichment analysis with top 8 hits presented as a bar plot. The x-axis and y-axis represent the gene count and pathway, respectively. Thresholds: FDR ≥ 0.05 and |log2 fold change| ≥1. (E) Confocal maximum intensity projection images of 3 dpf WT and fbn3–/– embryos displaying either a mild (M) or severe (S) phenotype, whole-mount stained to visualize the immune response. Endothelial cells are labeled by the Tg(kdrl:GFP) reporter (green), and neutrophils are labeled by anti-mpx antibody staining (red). Scale bar: 200 μm. (F) Quantification of 3 dpf WT and fbn3–/– embryos (n = 5-6) showing the total number of neutrophils in the tail region (top left), the number of neutrophils in the circulation in the CV and CA (top right), and the relative proportion between regions (bottom). Statistical analysis: one-way analysis of variance followed by Dunnett’s multiple comparisons test F. For the comparison of the total number of neutrophils in the tail region between WT and fbn3–/–(S), the P value was 0.054. Values are mean ± SEM. ∗P < 0.05, ∗∗P < 0.01. NS = nonsignificant; other abbreviations as in