
Figure 4
- ID
- ZDB-IMAGE-260501-109
- Publication
- De Rycke et al., 2026 - Systematic Disruption of Zebrafish Fibrillin Genes Identifies a Translational Zebrafish Model for Marfan Syndrome
- All Figures
- Figures for De Rycke et al., 2026
|
Figure 4
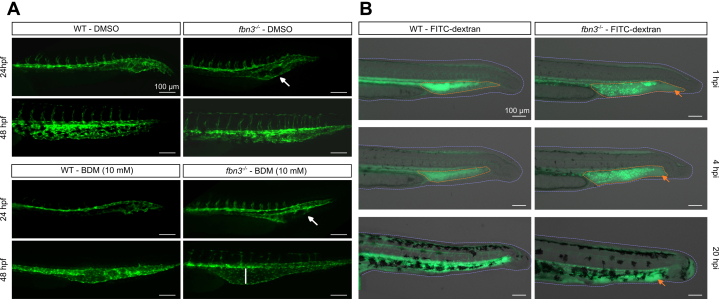
Abnormal Caudal Vein Development and Increased Vascular Permeability in fbn3–/– Embryos
(A) Caudal vein formation in Tg(kdrl:GFP) WT and mild fbn3–/– ZF at 24 and 48 hours postfertilization (hpf) after exposure to 1% dimethyl sulfoxide (DMSO) vehicle (top) or 10 mM 2,3-butanedione monoxime (BDM) to inhibit cardiac contraction (bottom). White arrow indicates abnormal development of the caudal vein. Exposure to BDM leads to more severe caudal vein dilatation (white line) in fbn3–/– embryos than in WT controls at 48 hpf (qualitative analysis). (B) The caudal vasculature of 500 kDa fluorescein isothiocyanate (FITC)-dextran–injected 30 hpf WT and Tg(globin:GFP) fbn3–/– embryos, imaged at 1, 4, and 20 hours postinjection (hpi) to assess vascular integrity. Orange dotted lines indicate intravenously injected dextran localization, and the red arrow indicates extravascular dye leakage. The purple dotted line outlines the embryo tail. Scale bar: 100 μm. Other abbreviations as in