
Figure 2
- ID
- ZDB-IMAGE-260501-107
- Genes
- Publication
- De Rycke et al., 2026 - Systematic Disruption of Zebrafish Fibrillin Genes Identifies a Translational Zebrafish Model for Marfan Syndrome
- All Figures
- Figures for De Rycke et al., 2026
|
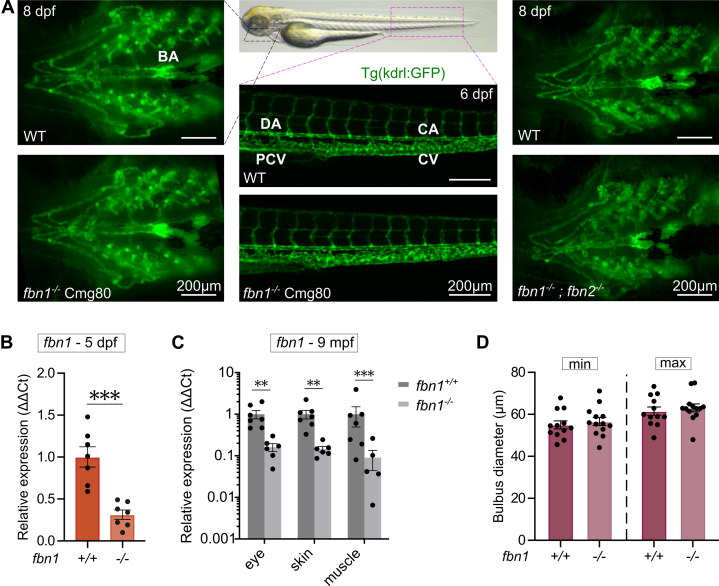
Figure 2
Cardiovascular Architecture in fbn1 and/or fbn2 Mutants
Fluorescent images of the vasculature of fbn1–/– (Cmg80) ZF with or without the additional loss of fbn2 at 8 dpf showed no phenotypic differences from wild-type (WT) ZF. (A, left and right) Ventral view of the ventral aorta and bulbus arteriosus (BA) of 6 to 8 dpf WT, fbn1–/–, and fbn1–/–; fbn2–/– larvae, respectively. (A, middle) Lateral view of the distal part of the dorsal aorta (DA) merging into the caudal aorta (CA) as well as the posterior cardinal vein (PCV) merging into the caudal vein (CV) in 6 dpf WT and fbn1–/– larvae. (B) Real-time quantitative PCR analysis of fbn1 expression in 5 dpf WT and fbn1–/– (Cmg80) larvae (n = 7). Each data point represents the mean of 2 technical repeats. (C) Real-time quantitative PCR analysis of fbn1 expression in eye, skin, and muscle tissue of 9 months postfertilization (mpf) WT and fbn1–/– (Cmg80) ZF (n = 5-7). (D) Quantification of BA diameters in 7 dpf fbn1–/– (Cmg80) and matched WT controls during minimal (min) and maximal (max) distension (n = 12-13). Values are mean ± SEM. Statistical analysis: unpaired t test (B) and two-way analysis of variance followed by Tukey’s multiple comparisons test (C and D). ∗∗P < 0.01, ∗∗∗P < 0.001. Other abbreviations as in