
Image
|
Figure Caption
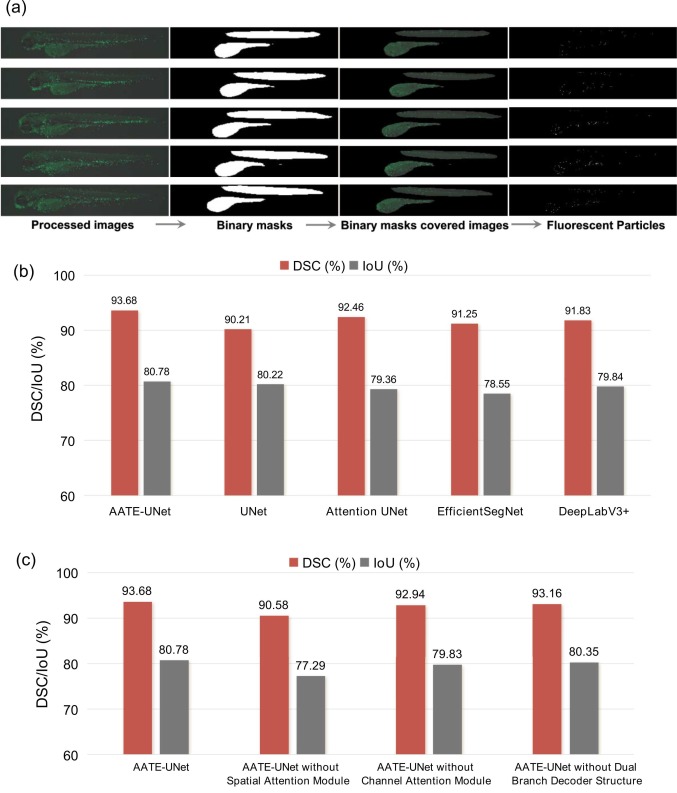
Fig. 3 (a) Image segmentation and fluorescent neutrophils quantification of AATE-UNet model (b) Comparison of models in DSC and IoU values (c) Influences of single variants on DSC and IoU values of AATE-UNet model.
Acknowledgments
This image is the copyrighted work of the attributed author or publisher, and
ZFIN has permission only to display this image to its users.
Additional permissions should be obtained from the applicable author or publisher of the image.
Full text @ Ecotoxicol. Environ. Saf.