
|
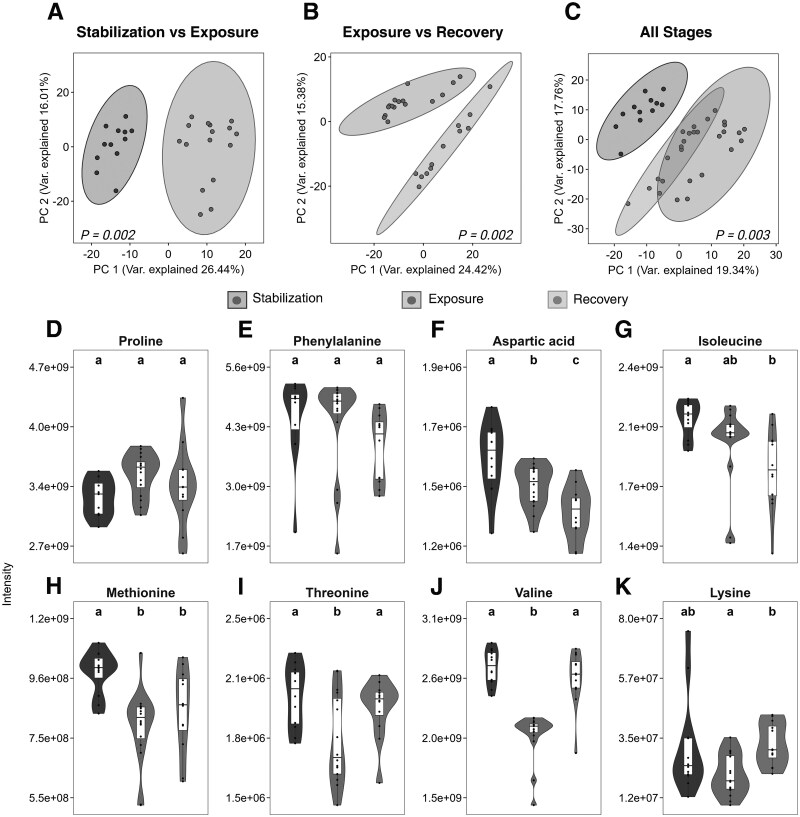
Fig. 6.
Untargeted metabolomic changes in SIHUMIx following azoxystrobin exposure. PCA of metabolite intensities comparing A) stabilization to exposure, B) exposure to recovery, and C) across all experimental stages; statistical significance determined using PERMANOVA. D-K) Violin plots depicting the distribution and density of 8 amino acid intensities across the different cultivation phases. Letters above each plot indicate significant differences between experimental phases, determined from linear mixed-effects models with bioreactor as a random effect and Tukey-adjusted post-hoc comparisons (