
|
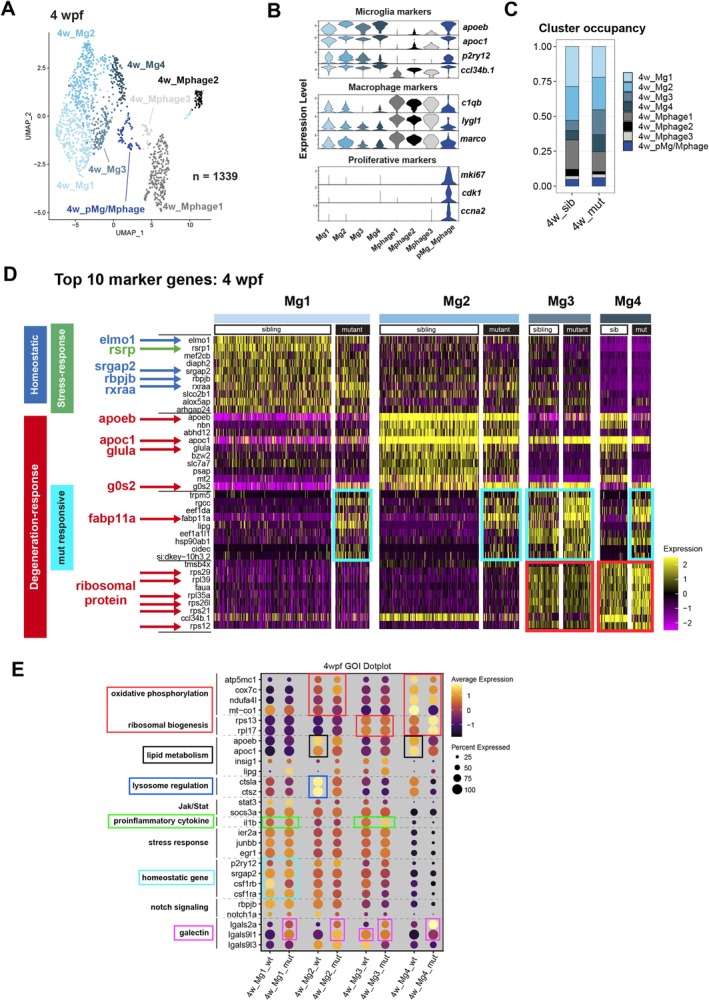
FIGURE 5
Identification of microglial clusters at the start of neuronal regeneration. (A) UMAP plot showing four microglial clusters, three macrophage clusters, and one proliferative microglia and macrophage‐mixed cluster at 4 wpf. Clustering resolution = 0.6. (B) Expression of microglia markers (apoeb, apoc1, p2ry12, ccl34b.1), macrophage markers (c1qb, lygl1, marco), and proliferative markers (mki67, cdk1, ccna2) per cluster at 4 wpf. (C) Fraction of each microglia and macrophage cluster in wild‐type siblings and pde6c mutants. (D) Heatmap of the top 10 enriched genes of each microglial cluster at 4 wpf. Degeneration‐response markers (apoeb, apoc1, glula, g0s2, fabp11a, ribosomal proteins), stress‐response marker (rsrp), and homeostatic markers (elmo1, srgap2, rbpjb, rxraa) are indicated. Microglial groups highly expressing 4w_Mg3‐enriched genes are indicated with light blue squares. Microglial groups highly expressing 4w_Mg4‐enriched genes are indicated with red squares. (E) Dotplot analysis of genes related to oxidative phosphorylation, ribosomal biogenesis, lipid metabolism, lysosome regulation, Jak/Stat, il1b, stress response, homeostatic genes, Notch signaling, and galectin genes. Microglial groups highly expressing each category of genes are marked with color‐coded squares.