
Figure 9
- ID
- ZDB-IMAGE-260418-22
- Publication
- Patel et al., 2026 - Cdhr1a and pcdh15b may link photoreceptor outer segments with calyceal processes revealing a potential mechanism for cone-rod dystrophy
- All Figures
- Figures for Patel et al., 2026
|
Figure 9
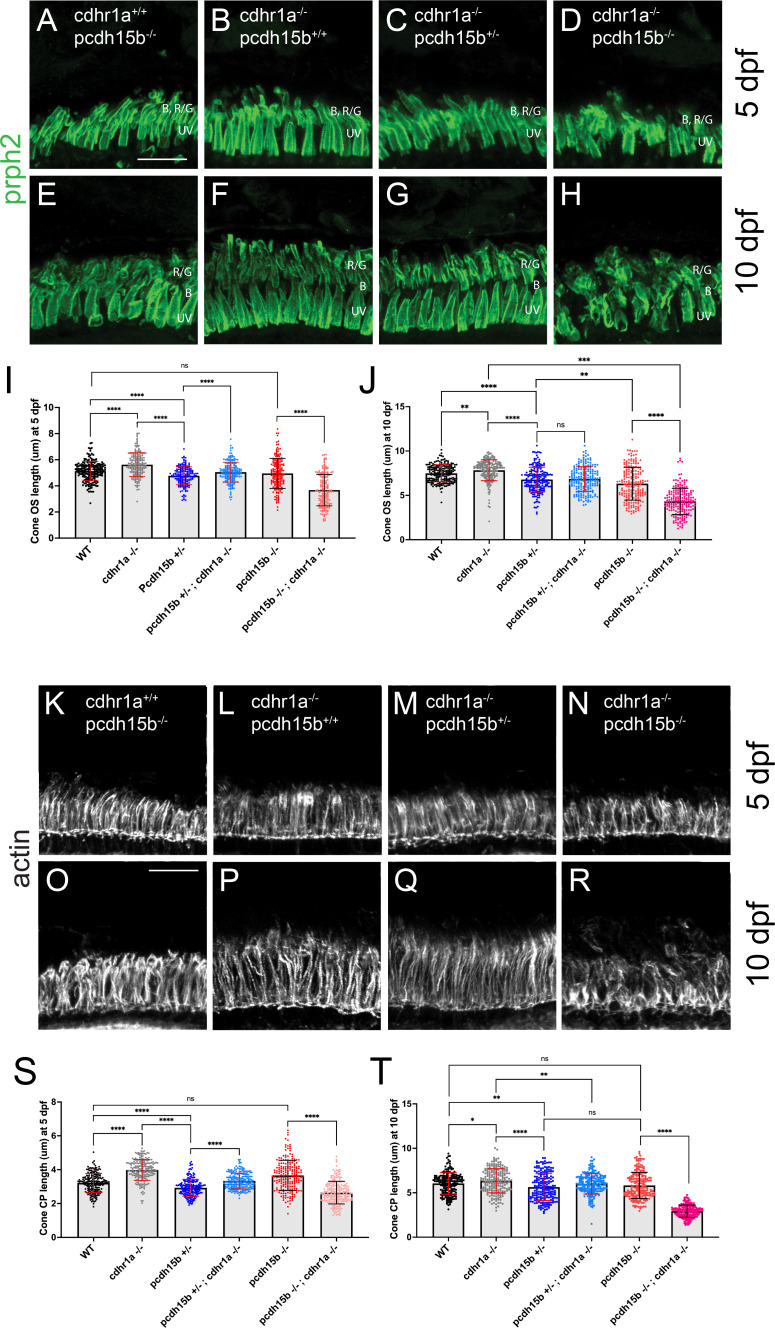
Cone phenotypes are exacerbated by simultaneous loss of pcdh15b and cdhr1a.
(A–D) Confocal microscopy of retinal cryosections from 5 dpf pcdh15b-/-, cdhr1a-/-, cdhr1a-/-; pcdh15b+/- and cdhr1a-/-; pcdh15b-/- larva probed with prph2 antibodies (green). COS = cone outer segment. B=blue cones, RG = red/green cones, UV = UV cones. Scale bar = 10 μm. (E–H) Confocal microscopy of retinal cryosections from 10 dpf pcdh15b-/-, cdhr1a-/-, cdhr1a-/-; pcdh15b+/- and cdhr1a-/-; pcdh15b -/- larva probed with prph2 antibodies (green). COS = cone outer segment. B=blue cones, RG = red/green cones, UV = UV cones. Scale bar = 10 μm. (I) Quantification of cone outer segment length at 5 dpf based on prph2 signal. ns = not significant, ****=p < 0.0001. ANOVA = p < 0.0001. (J) Quantification of cone outer segment length at 10 dpf based on prph2 signal. ns = not significant, **=p < 0.01, ****=p < 0.0001. ANOVA = p < 0.0001. (K–N) Confocal microscopy of retinal cryosections from 5 dpf pcdh15b-/-, cdhr1a-/-, cdhr1a-/-; pcdh15b+/- and cdhr1a-/-; pcdh15b -/- larva probed with actin antibodies (white). COS = cone outer segment. Scale bar = 10 μm. (O–R) Confocal microscopy of retinal cryosections from 10 dpf pcdh15b-/-, cdhr1a-/-, cdhr1a-/-; pcdh15b+/- and cdhr1a-/-; pcdh15b-/-larva probed with actin antibodies (white). COS = cone outer segment. Scale bar = 10 μm. (R) Quantification of cone CP length at 5 dpf based on prph2 signal. ns = not significant, ****=p < 0.0001. ANOVA = p < 0.0001. (T) Quantification of cone CP length at 10 dpf based on prph2 signal. ns = not significant, *=p < 0.05 **=p < 0.01****,=p < 0.0001. ANOVA = p < 0.0001.