IMAGE

FIGURE 6

ID
ZDB-IMAGE-260418-10
Source
Figures for Nakatani et al., 2026
Image
Figure Caption

FIGURE 6

Exploration of potential tet‐resistant bacteria in the bacterial flora of Indonesian aquaculture environments. The potential tet‐resistant bacteria determined through the culture experiment (Table
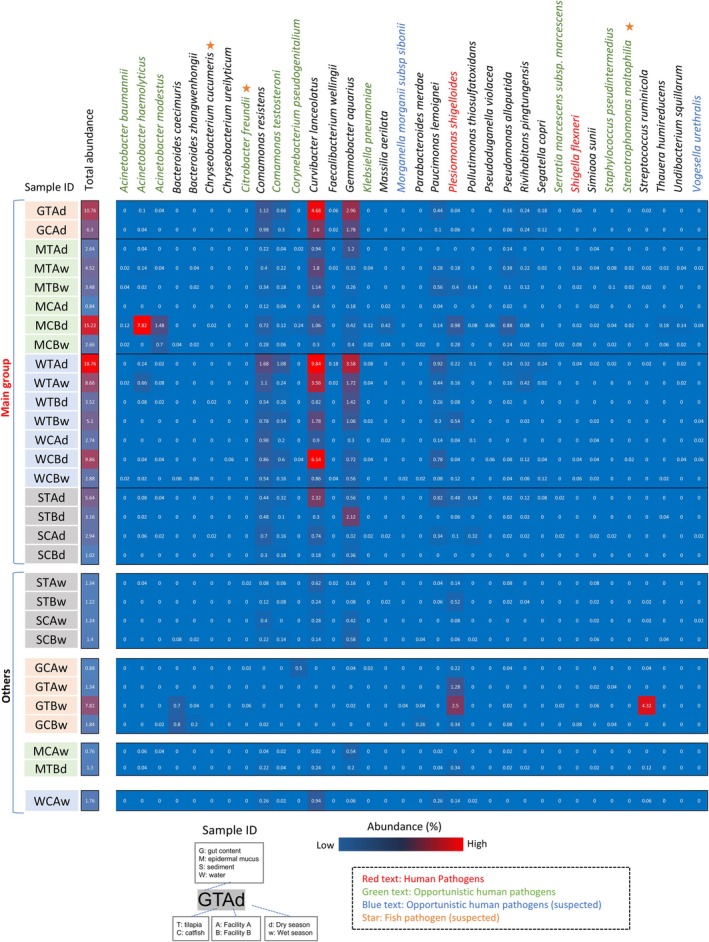
 2) and the analysis of tet‐resistance genes (Figure 4) were analysed to determine the proportion of 16S rRNA gene sequences associated with these bacteria within the bacterial flora of each group categorised in Figure 5B. The proportions were visualised as a heatmap for each sample. Sequence data from samples with the same sampling site, fish species, facility and season were merged and used for the analysis. Only the species detected in any sample were shown.

Acknowledgments
This image is the copyrighted work of the attributed author or publisher, and ZFIN has permission only to display this image to its users. Additional permissions should be obtained from the applicable author or publisher of the image. Full text @ Environ Microbiol Rep