IMAGE

Figure 4

ID
ZDB-IMAGE-260416-53
Source
Figures for Anderson et al., 2026
Image
Figure Caption

Figure 4

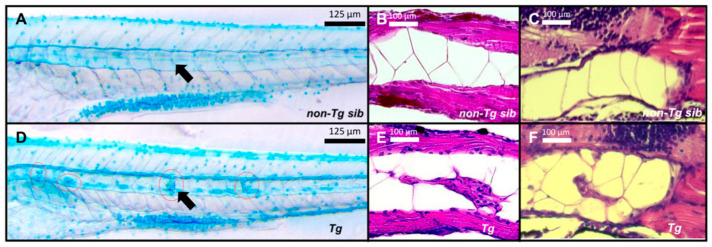
Development of notochord tumors in zebrafish. (A) Alcian Blue staining of non-Tg larvae at 6 dpf. (B) Coronal section of non-Tg larvae tail at 6 dpf with H&E staining. (C) Sagittal section of non-Tg larvae tail at 6 dpf with H&E staining. (D) Alcian Blue staining of Tg larvae at 6 dpf. The red circles denote notochordal neoplasms. Black arrows indicate the notochord in panels (A,D). (E) Coronal section of Tg larvae tail at 6 dpf with H&E staining. (F) Sagittal sections of Tg larvae tail at 6 dpf with H&E staining. These data show that expression of EWSR1::FLI1 in col2a1a-expressing cells disrupts normal notochord organization and induces dysplastic notochordal growths during early zebrafish development, as demonstrated by abnormal cellular proliferation and proteoglycan-rich lesions detected by Alcian Blue staining and histological analysis.

Acknowledgments
This image is the copyrighted work of the attributed author or publisher, and ZFIN has permission only to display this image to its users. Additional permissions should be obtained from the applicable author or publisher of the image. Full text @ Int. J. Mol. Sci.