
Image
|
Figure Caption
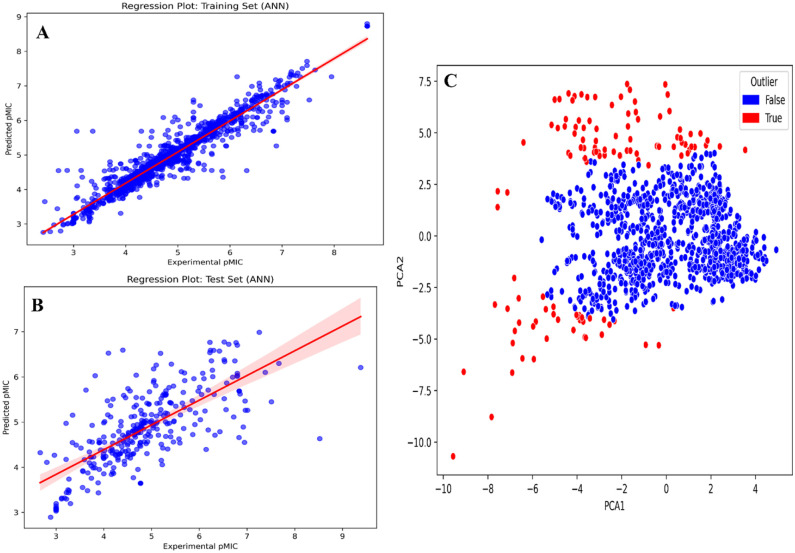
Figure 2.
(A) and (B) Regression plots of training and test, respectively, of our final ANN-QSAR model and (C) outlier analysis during QSAR model development using PCA.
Acknowledgments
This image is the copyrighted work of the attributed author or publisher, and
ZFIN has permission only to display this image to its users.
Additional permissions should be obtained from the applicable author or publisher of the image.
Full text @ Bioinform. Biol. Insights