IMAGE

Fig. 4

ID
ZDB-IMAGE-260408-63
Source
Figures for Zhang et al., 2026
Image
Figure Caption

Fig. 4

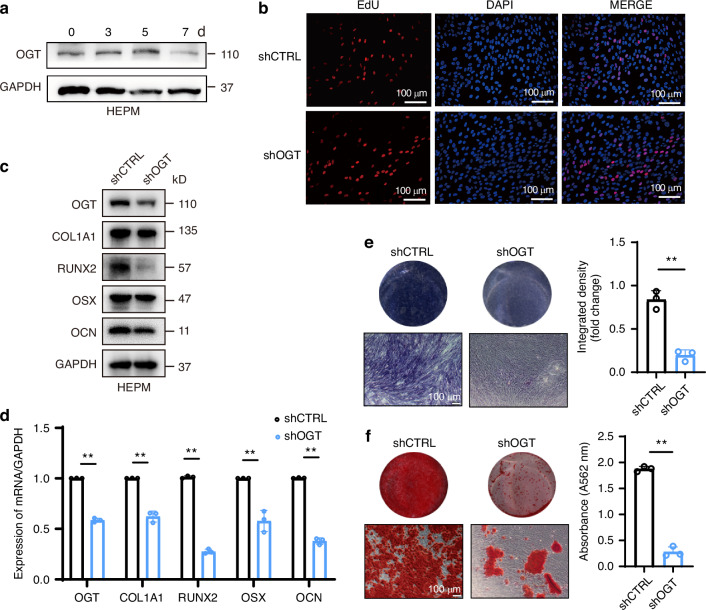
Negative impact of OGT knockdown in HEPM cells on in vitro osteogenic differentiation. a WB analysis of OGT protein level during osteogenic differentiation. b Representative Edu staining images of in shCtrl and shOGT HEPM cells. shCtrl short hairpin control (control lentivirus), shOGT short hairpin OGT (OGT lentivirus). c Expression of osteogenic markers (COL1A1, RUNX2, OSX, and OCN) and the protein levels of HEPM cells treated as indicated and assessed by WB. d Expressions of osteogenic genes (COL1A1, RUNX2, OSX, and OCN) and the mRNA levels of HEPM cells treated as indicated and assessed by RT-qPCR. e, f ALP and ARS staining of HEPM cells treated as indicated. Data were indicated by mean ± SD. n = 3 biologically independent experiments. P-values were computed by two-tailed t-test or one-way ANOVA followed by Tukey’s multiple comparisons test, *P < 0.05, **P < 0.01

Acknowledgments
This image is the copyrighted work of the attributed author or publisher, and ZFIN has permission only to display this image to its users. Additional permissions should be obtained from the applicable author or publisher of the image. Full text @ Int J Oral Sci