IMAGE

Fig. 1.

ID
ZDB-IMAGE-260408-36
Source
Figures for Wada et al., 2026
Image
Figure Caption

Fig. 1.

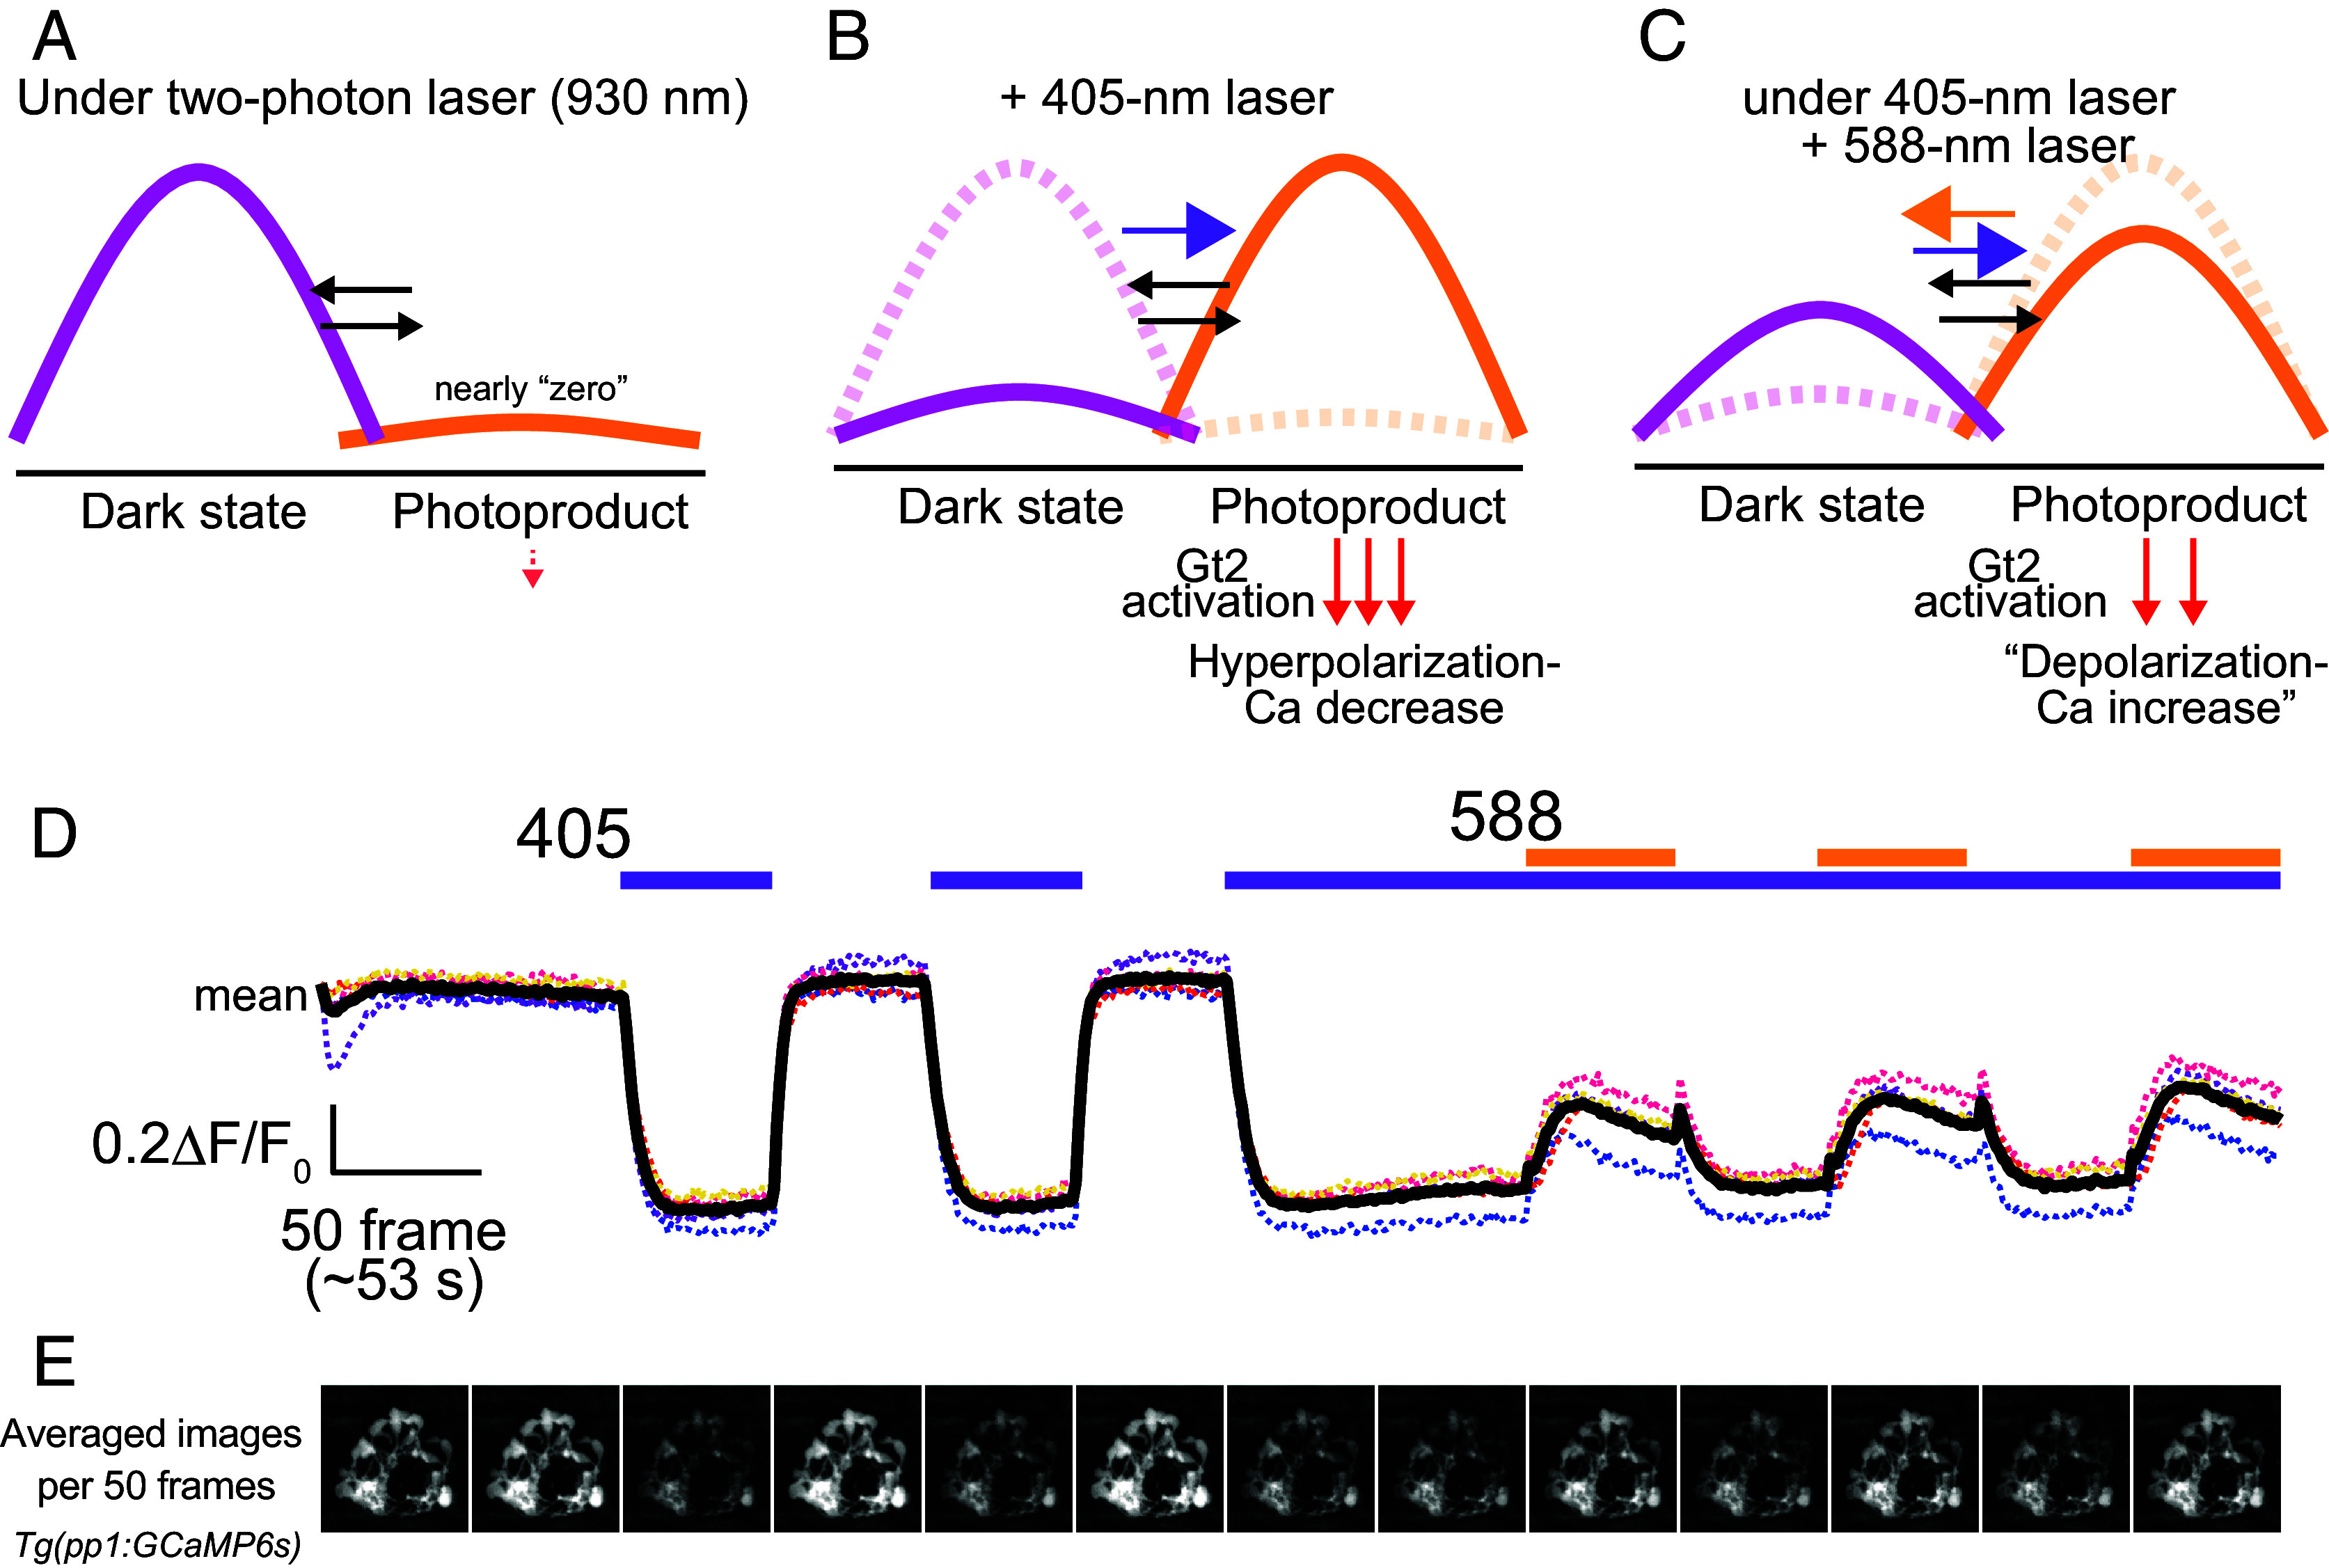
Light irradiation protocol generating PP1-specific responses in wild-type larvae. (AC) Schematic representations illustrating the photoequilibrium between the two states of bistable PP1. (D) Calcium change profiles in PP1-expressing cells of Tg(pp1:GCaMP6s) larvae (5 to 6 dpf) in response to 405-nm (UV, purple bars) and 588-nm (visible light, yellow bars) laser stimuli, recorded using two-photon imaging. Bold and dotted traces indicate the mean and individual profiles, respectively (n = 5). Fluorescence intensities were normalized to the initial values. Spike-like calcium increases following visible-light exposures are due to apparatus lag time (transient darkness) during light-condition switching. (E) Averaged images (dorsal view) showing GCaMP fluorescence in PP1-expressing cells of the pineal organ in Tg(pp1:GCaMP6s) larvae over 50 frames. The images represent areas of 80 × 80 μm.

Acknowledgments
This image is the copyrighted work of the attributed author or publisher, and ZFIN has permission only to display this image to its users. Additional permissions should be obtained from the applicable author or publisher of the image. Full text @ Proc. Natl. Acad. Sci. USA