
IMAGE
Fig. 2
- ID
- ZDB-IMAGE-260408-2
- Publication
- Hernandez Herrera et al., 2026 - ercc6 deficient zebrafish exhibit UV and metronidazole sensitivity, increased oxygen consumption, and impaired hair cell mechanoelectrical transduction which can be restored by the superoxide dismutase mimetic MnTBAP
- All Figures
- Figures for Hernandez Herrera et al., 2026
Image
|
Figure Caption
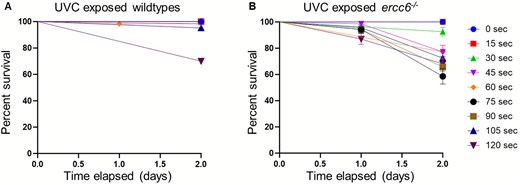
Fig. 2 Survival rates across multiple timepoints following incremental doses of UVC. Composite survival curves for 0–120 s UVC exposure at 15 s increments in (A) wildtype and (B) ercc6−/−. Curves represent the summation of three independent experiments. Data is from 3 replicate experiments with 20–23 larvae per group, per experiment and is represented by percent survival ± SE. Detailed breakdown of descriptive statistics available in Table 1. Further breakdown of timepoint comparison groups is available in Supplemental Fig. 5.
Figure Data
Acknowledgments
This image is the copyrighted work of the attributed author or publisher, and
ZFIN has permission only to display this image to its users.
Additional permissions should be obtained from the applicable author or publisher of the image.
Full text @ Hum. Mol. Genet.