
|
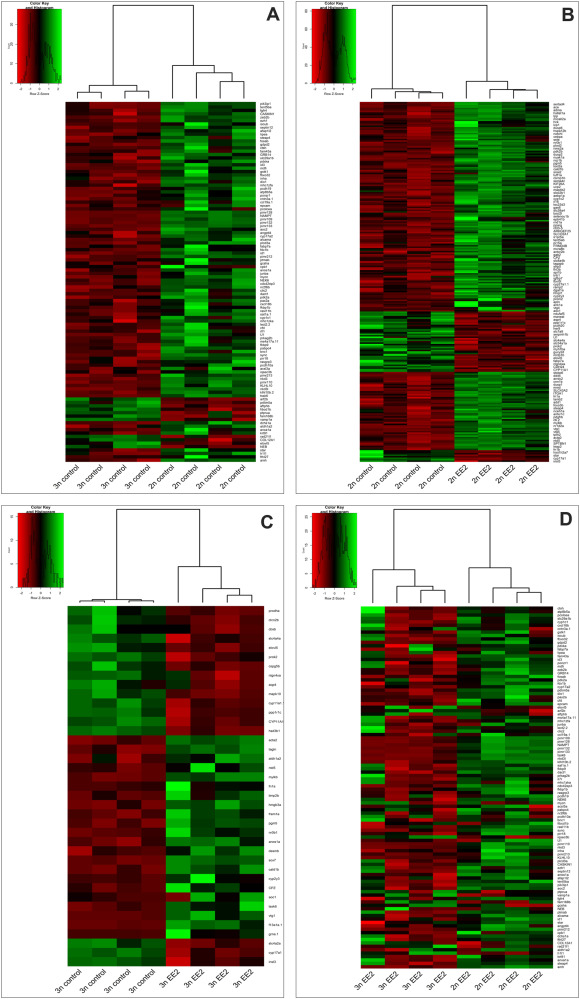
Fig. 6 Heatmaps showing the hierarchical clustering of differentially expressed genes (DEGs) in zebrafish gonads based on RNA-seq data. (A) Comparison between untreated diploid (2n control) and triploid (3n control) gonads, (B) between untreated diploid (2n control) and EE2-treated diploid (2n EE2) gonads, and between (C) untreated triploid (3n control) and EE2-treated triploid (3n EE2) gonads. (D) Heatmap showing combined comparison across all EE2-treated triploid vs triploid gonads, highlighting uniquely DEGs between ploidy types under hormone exposure. Only selected genes are presented in each heat map. Each row corresponds to a gene and each column to an individual sample (four samples per experimental group). Color intensity indicates Z-score normalized gene expression (red: high expression, green: low expression). Heatmaps were constructed with variance-stabilized expression values obtained with the DESeq2 function vst (.) were clustered based on Euclidean distances. High-resolution versions of the heatmaps are available in the online supplementary materials. (For interpretation of the references to color in this figure legend, the reader is referred to the Web version of this article.)
Reprinted from Molecular and Cellular Endocrinology, , Torres-Martínez, A., Tichopád, T., Pšenička, M., Franěk, R., Triploidy alters hormonal and paracrine signaling to promote male development in zebrafish, 112740112740, Copyright (2026) with permission from Elsevier. Full text @ Mol. Cell. Endocrinol.