
Fig. 3
- ID
- ZDB-IMAGE-260401-124
- Publication
- Dereddi et al., 2026 - Oligodendrocyte mechanotransduction channel TMEM63A regulates myelin sheath geometry
- All Figures
- Figures for Dereddi et al., 2026
|
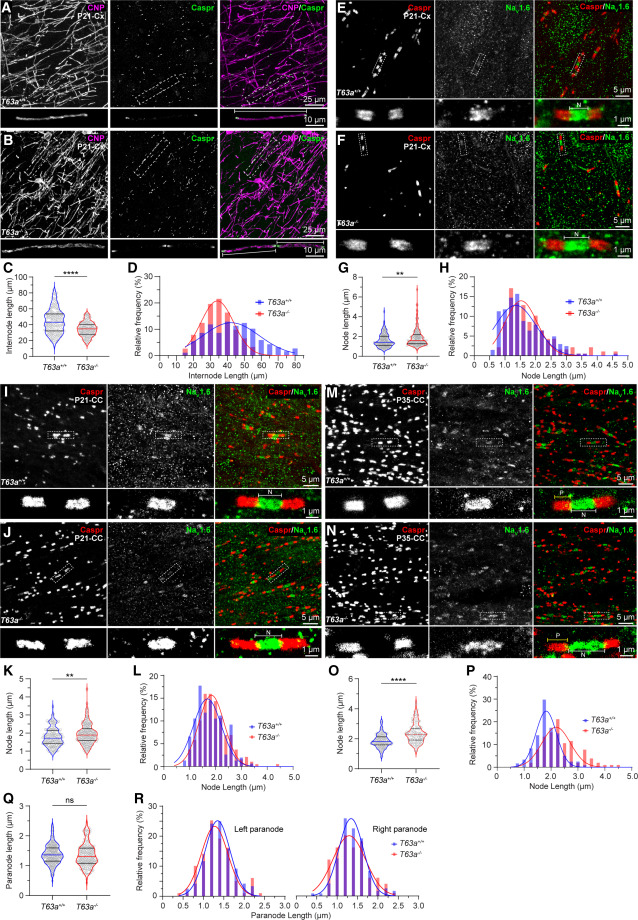
Fig. 3 TMEM63A is required for fine-tuning lateral myelin sheath geometry (A–D) Cx of T63a+/+ (A) and T63a−/− (B) mouse brains at P21 immunostained for CNP and Caspr. Internode lengths in μm (C) and relative frequency distribution (D). (E–H) Cx of T63a+/+ (E) and T63a−/− (F) mouse brains at P21 immunostained for Nav1.6 and Caspr. Node lengths in μm (G) and relative frequency distribution (H). (I–L) CC of T63a+/+ (I) and T63a−/− (J) mice at P21 immunostained for Nav1.6 and Caspr. Node lengths in μm (K) and relative frequency distribution (L). (M–R) CC of T63a+/+ (M) and T63a−/− (N) mouse brains at P35 immunostained for Nav1.6 and Caspr. Node lengths in μm (O) and relative frequency distribution (P). Paranode lengths in μm (Q) and relative frequency distribution (R). Higher magnifications of boxed areas show CNP-labeled myelin internodes (A and B) and Nav1.6-labeled nodes (E, F, I, J, M, and N) flanked by Caspr+ paranodes. N, node; P, paranode. Histograms fitted with a Gaussian function. Data represent median and interquartile range (C, G, K, O, and Q). ns, non-significant, p > 0.05 (including R), ∗p < 0.05 (including H), ∗∗p < 0.01 (including L), ∗∗∗∗p < 0.0001 (including D and P). See also Figure S5 and Table S3 (sample sizes and statistical tests).