IMAGE

Figure 4

ID
ZDB-IMAGE-260330-75
Source
Figures for Carneiro et al., 2026
Image
Figure Caption

Figure 4

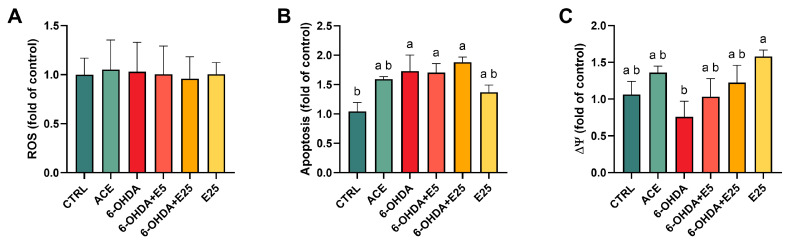
Assessment of oxidative stress and cell health markers in 120 hpf zebrafish larvae. (A) Reactive oxygen species (ROS) levels, (B) apoptosis, and (C) mitochondrial membrane potential. Data are normalized to control values and presented as median and interquartile ranges from five independent replicates (10 larvae per replicate, n = 1). Statistical analysis was performed using the Kruskal–Wallis test followed by Dunn’s test. Different letters indicate statistically significant differences between treatment groups (p < 0.05). CTRL (E3 medium), ACE (0.05% acetone), 6-OHDA (250 µM), 6-OHDA+E5 (250 µM 6-OHDA + 5 µg/mL extract), 6-OHDA+E25 (250 µM 6-OHDA + 25 µg/mL extract), and E25 (25 µg/mL extract).

Acknowledgments
This image is the copyrighted work of the attributed author or publisher, and ZFIN has permission only to display this image to its users. Additional permissions should be obtained from the applicable author or publisher of the image. Full text @ Int. J. Mol. Sci.