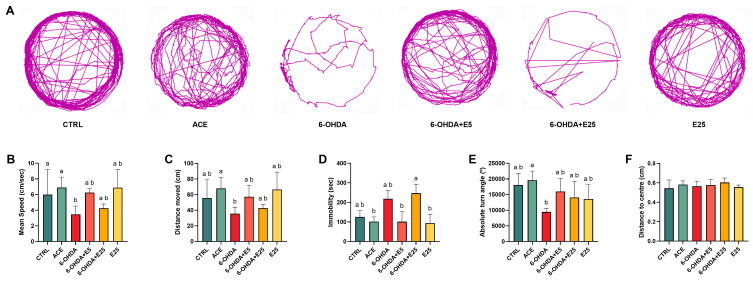
Locomotor activity analysis of zebrafish larvae at 120 hpf. (A) Representative locomotion tracking paths; (B) swimming speed; (C) total distance travelled; (D) immobility time; (E) turning angle; and (F) distance to centre. Data are presented as median values with interquartile ranges or as mean ± SD (F) based on 5 independent replicates (10 larvae per replicate, n = 1). Statistical analysis was conducted using the Kruskal–Wallis test, followed by Dunn’s test or one-way ANOVA test, followed by Tukey’s post hoc test. Different letters indicate statistically significant differences between treatment groups (p < 0.05). CTRL (E3 medium), ACE (0.05% acetone), 6-OHDA (250 µM), 6-OHDA+E5 (250 µM 6-OHDA + 5 µg/mL extract), 6-OHDA+E25 (250 µM 6-OHDA + 25 µg/mL extract), and E25 (25 µg/mL extract).
Acknowledgments
This image is the copyrighted work of the attributed author or publisher, and
ZFIN has permission only to display this image to its users.
Additional permissions should be obtained from the applicable author or publisher of the image.
Full text @ Int. J. Mol. Sci.
Your Input Welcome
Thank you for submitting comments. Your input has been emailed to ZFIN curators who may contact you if
additional information is required.
Oops. Something went wrong. Please try again later.