
|
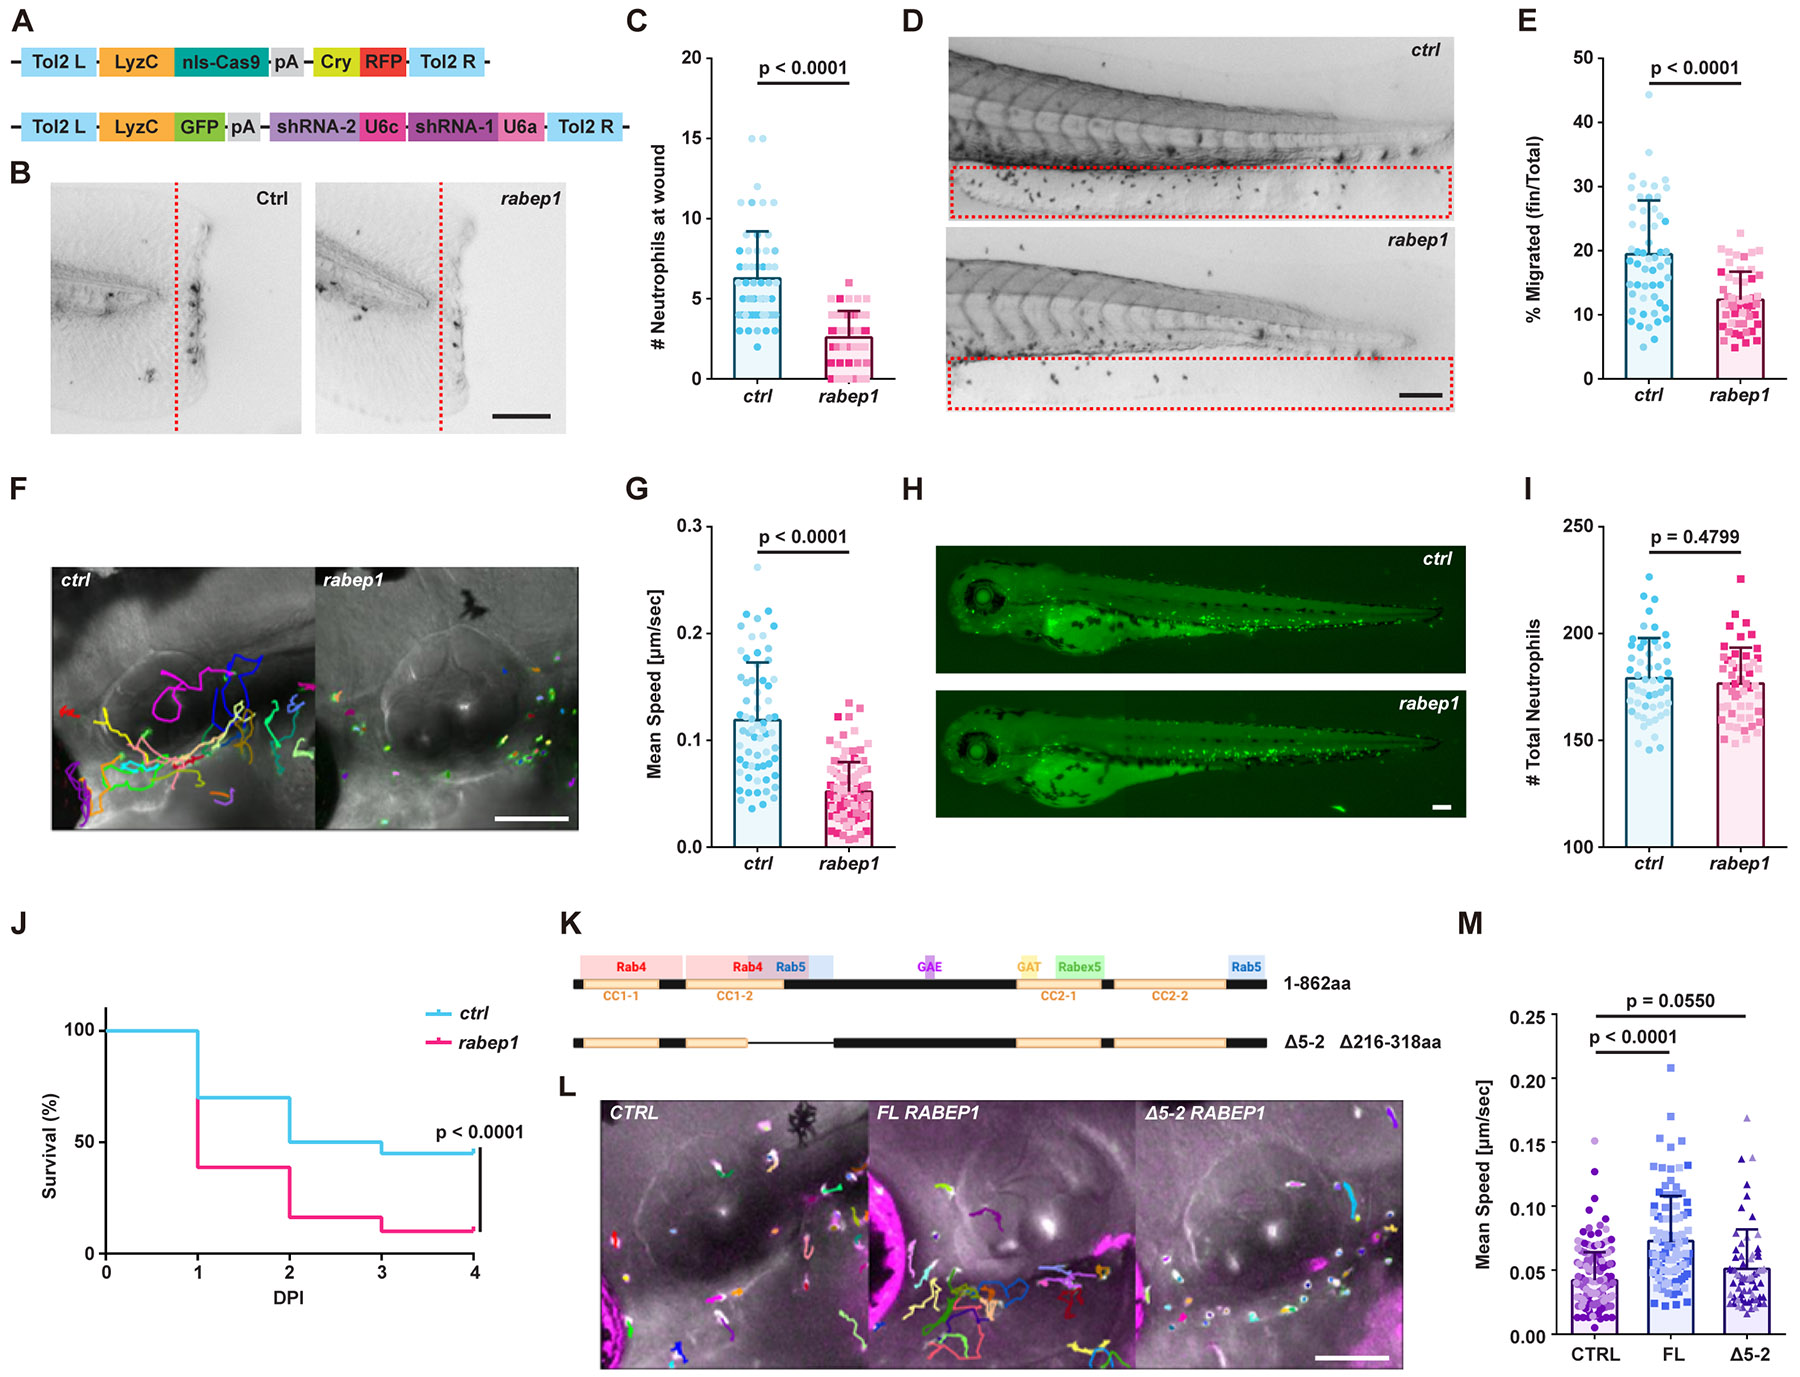
Fig. 3 Knockout of Rabep1 in zebrafish neutrophils causes reduced cell motility and chemotaxis. (A) Diagram of the Cas9-expressing plasmid and sgRNA-expressing plasmid used to create rabep1 TSKO and control TSKO transgenic fish lines. (B, C) Representative images and quantification of neutrophil recruitment to the tail wound site in Tg(LyzC: ctrl sgRNAs, LyzC: Cas9, Cry: RFP) and Tg(LyzC: rabep1 sgRNAs, LyzC: Cas9, Cry: RFP) larvae 1 hour after wounding. Scale bar, 100 μm. The experiment was performed with 3 biological repeats, each comprising 11-22 fish per group. Data are presented as mean ± SD and analyzed using the Mann-Whitney test. (D, E) Representative images and quantification of neutrophil chemotaxis percentage from CHT to the caudal fin after 15 minutes of LTB4 exposure in control TSKO and rabep1 TSKO larvae. Scale bar, 100 μm. The experiment was performed with 3 biological repeats, each with 16-20 fish per group. Data are shown as mean ± SD, analyzed with the Mann-Whitney test. (F, G) Representative images and quantification of live neutrophil motility in control TSKO and rabep1 TSKO larvae over 30 minutes. Scale bar, 100 μm. The experiment was performed with three biological repeats, each tracking 19-38 neutrophils from three to four fish per group. Data are presented as mean ± SD and analyzed using the Mann-Whitney test. (H, I) Representative GFP images and Sudan black staining quantification of overall neutrophil counts in control TSKO and rabep1 TSKO larvae. Scale bar, 100 μm. The experiment was performed with three biological repeats, each with 16-19 fish per group. Data are shown as mean ± SD, analyzed with the Mann-Whitney test. (J) Survival analysis comparing rabep1 TSKO with control TSKO. The experiment included three biological repeats, totaling 80 rabep1 TSKO larvae and 60 control TSKO larvae. Data are presented using the Mantel-Cox test. (K) Diagram of the full-length and Δ5-2 RABEP1 protein. (L, M) Representative images and quantification of neutrophil motility in larvae from rabep1 TSKO crossed with Tol2-LyzC-RFP control, FL RABEP1 OE, or Δ5-2 RABEP1 OE over a 30-minute period. Scale bar, 100 μm. The experiment was performed with three biological repeats, each tracking 17-37 neutrophils from 2 to 4 fish per group. Data are presented as mean ± SD and analyzed using Dunnett's multiple comparisons test.