
Image
|
Figure Caption
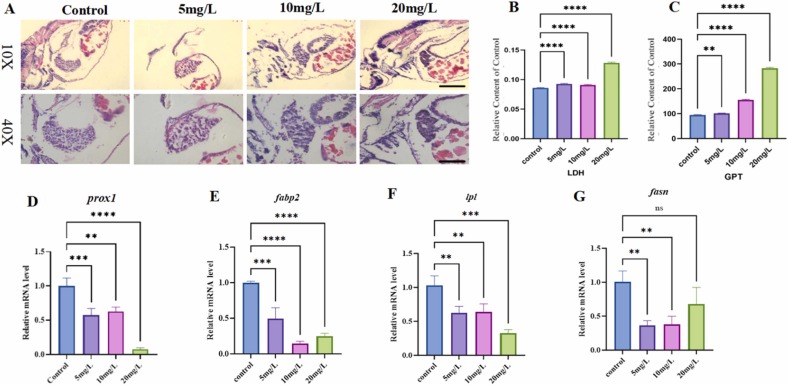
Fig. 4 Effects of 1,6-DHN on liver morphology, development, and metabolism.(A) H&E staining.(B, C) Activity of GPT and LDH in larvae fish.(D-G) mRNA levels of prox1, fabp2, lpl, and fasn in larvae fish as measured by real-time quantitative PCR.Data are presented as mean ± SD from three independent experiments.(n = 20, *p < 0.05,**p < 0.01,***p < 0.001,mean ± S.D).Scale bar: 100 µm.
Acknowledgments
This image is the copyrighted work of the attributed author or publisher, and
ZFIN has permission only to display this image to its users.
Additional permissions should be obtained from the applicable author or publisher of the image.
Full text @ Ecotoxicol. Environ. Saf.