
Fig. 6
- ID
- ZDB-IMAGE-260327-55
- Publication
- Bertino et al., 2026 - Mitochondrial energetic failure underlies FLVCR1-related sensory neuropathy
- All Figures
- Figures for Bertino et al., 2026
|
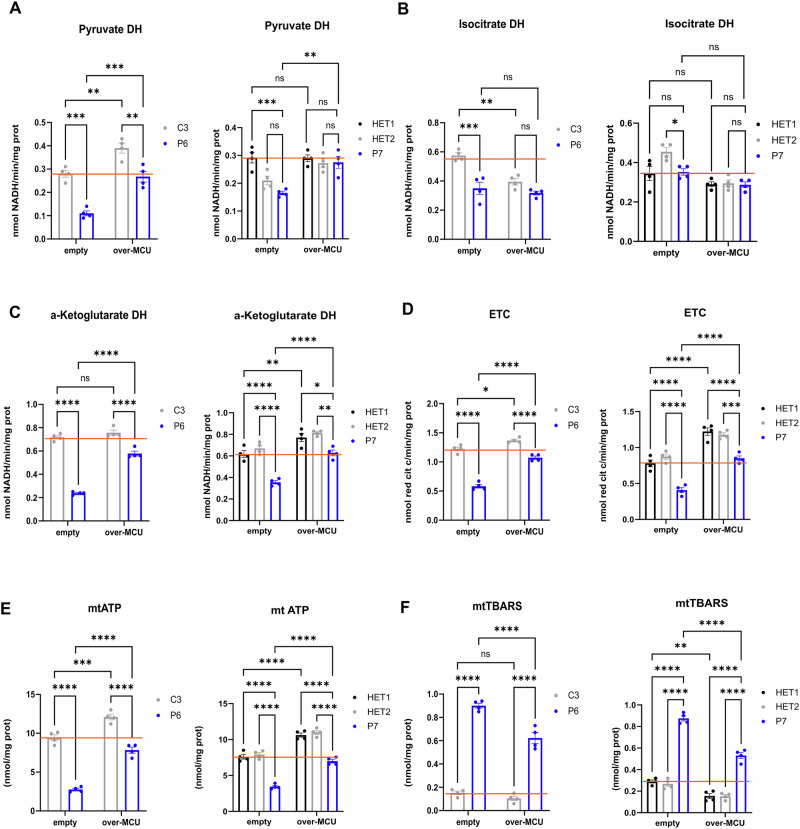
Fig. 6 Primary fibroblasts from patient P6 compared to control C3 and from patient P7 compared to HET1 and HET2. Cells overexpressing MCU (over-MCU) were compared to cells transfected with the control vector (empty). Each dot in the graphs represents an independent experimental replicate. A Pyruvate dehydrogenase activity. B Isocitrate dehydrogenase activity. C a-ketoglurate dehydrogenase activity. D Total electron transport chain activity. E Mitochondrial ATP levels. F Mitochondrial thiobarbituric acid reactive substance (TBARS) levels used as index of lipid peroxidation. A–F N = 4 independent experiments. Two-way ANOVA analysis of variance was performed. * = P < 0.5; ** = P < 0.01; *** P = < 0.001; **** P = 0.0001. Error bars denote the standard error of the mean (SEM).