
Image
|
Figure Caption
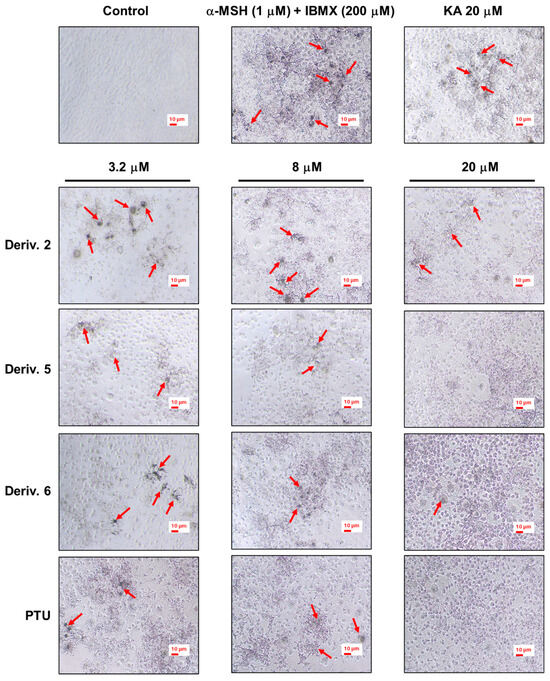
Fig. 8 In situ B16F10 cTYR inhibition effects of derivatives 2, 5, and 6. These derivatives were used as test samples, and PTU and KA were used as positive reference substances. KA was tested at 20 μM, whereas 2, 5, 6, and PTU were tested at concentrations of 3.2, 8, and 20 μM. Following 1 h of sample treatment, stimulators (IBMX/α-MSH [200 μM/1 μM]) were administered to B16F10 cells for 72 h. Following l-DOPA (2 mM) treatment for 2 h, melanin-stained cells were photographed to determine in situ cTYR activity. The red arrows indicate cells that are heavily stained with melanin.
Acknowledgments
This image is the copyrighted work of the attributed author or publisher, and
ZFIN has permission only to display this image to its users.
Additional permissions should be obtained from the applicable author or publisher of the image.
Full text @ Molecules