
Image
|
Figure Caption
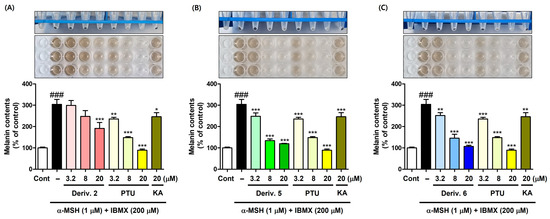
Fig. 7 Inhibition effect of AAMA derivatives on B16F10 cellular melanin content. Derivatives 2 (A), 5 (B), and 6 (C) were used as test samples, and PTU and KA were used as positive reference substances. KA was tested at 20 μM, whereas 2, 5, 6, and PTU were tested at three different concentrations (3.2, 8, and 20 μM). Following 1 h of sample treatment, stimulators (IBMX/α-MSH [200 μM/1 μM]) were administered to B16F10 cells for 72 h. * p < 0.05, ** p < 0.01, and *** p < 0.001 vs. group treated with stimulators; ### p < 0.001 vs. control.
Acknowledgments
This image is the copyrighted work of the attributed author or publisher, and
ZFIN has permission only to display this image to its users.
Additional permissions should be obtained from the applicable author or publisher of the image.
Full text @ Molecules