
Image
|
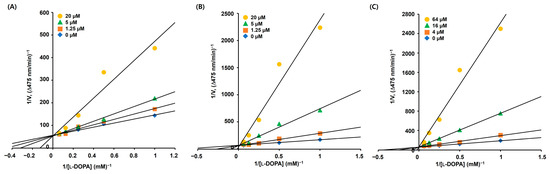
Figure Caption
Fig. 3 Lineweaver–Burk (L–B) plots of AAMA derivatives obtained from the kinetic experiments conducted using mTYR. (A–C) represent L–B plots of 5, 9, and 10, respectively. Derivatives 5 and 9 were tested at 0, 1.25, 5, and 20 μM, and derivative 10 was tested at 0, 4, 16, and 64 μM. The substrate, l-DOPA, was used at 1, 2, 4, 8, and 16 mM.
Acknowledgments
This image is the copyrighted work of the attributed author or publisher, and
ZFIN has permission only to display this image to its users.
Additional permissions should be obtained from the applicable author or publisher of the image.
Full text @ Molecules