
Image
|
Figure Caption
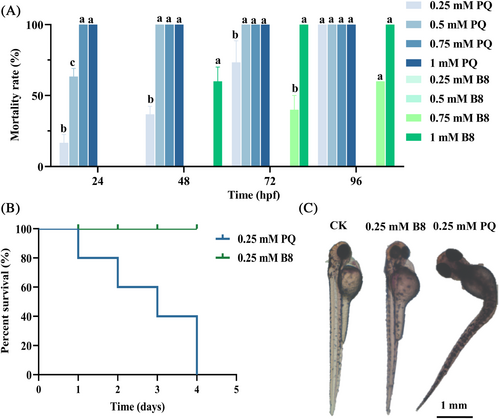
Fig. 5 Mortality rate of zebrafish in PQ and B8 in 96 hpf (A). Survival curves of zebrafish (B). Impact of the compounds on zebrafish development (C). Data are means of three replications; values with different letters differ significantly (P < 0.05).
Acknowledgments
This image is the copyrighted work of the attributed author or publisher, and
ZFIN has permission only to display this image to its users.
Additional permissions should be obtained from the applicable author or publisher of the image.
Full text @ Pest Manag. Sci.