
Image
|
Figure Caption
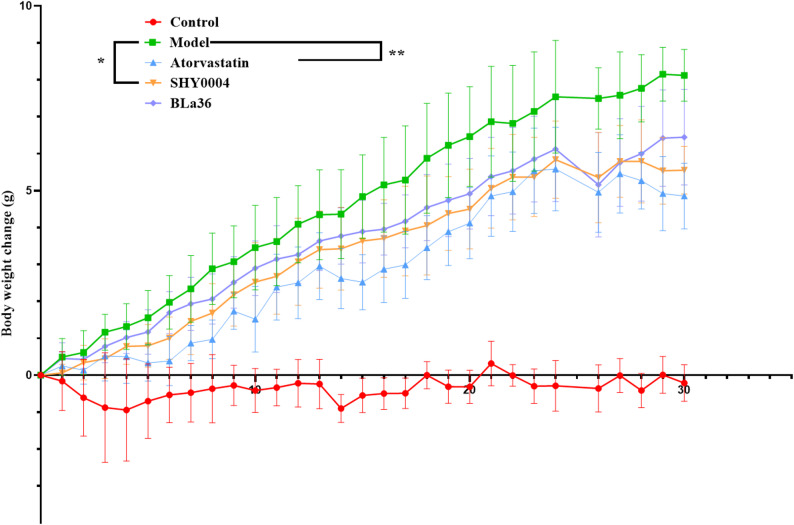
Fig. 8
Body weight changes in mice during the experimental period. Data were expressed as mean ± SEM.
Acknowledgments
This image is the copyrighted work of the attributed author or publisher, and
ZFIN has permission only to display this image to its users.
Additional permissions should be obtained from the applicable author or publisher of the image.
Full text @ BMC Microbiol.