
Image
|
Figure Caption
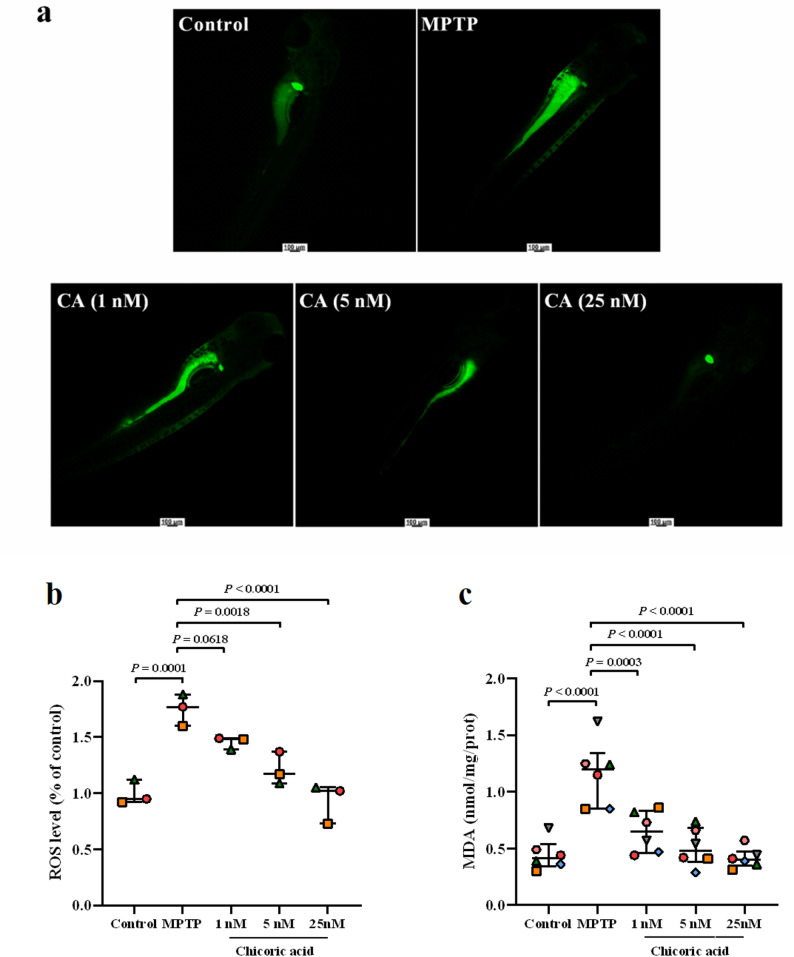
Fig. 3
Effects of CA on levels of ROS and MDA in the MPTP-induced zebrafish PD model.
Acknowledgments
This image is the copyrighted work of the attributed author or publisher, and
ZFIN has permission only to display this image to its users.
Additional permissions should be obtained from the applicable author or publisher of the image.
Full text @ BMC Complement Med Ther