IMAGE

FIGURE 5

ID
ZDB-IMAGE-260311-626
Source
Figures for Whyte-Fagundes et al., 2025
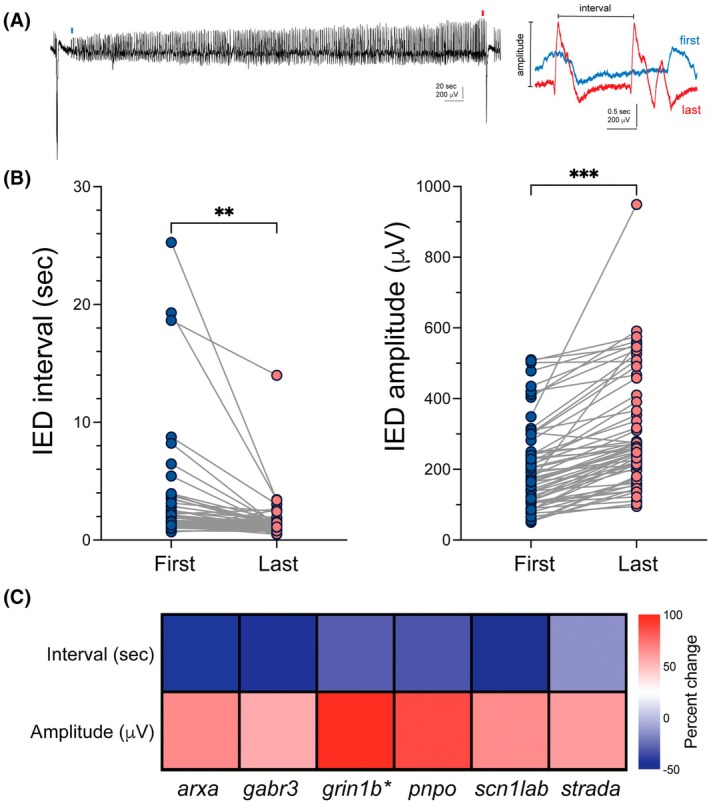
Image
Figure Caption

FIGURE 5

Interictal spikes (IS). (A) Representative raw local field potential trace (15 min) from a grin1b‐heterozygote zebrafish exhibiting type I interictal and type II ictal discharge activity (left). High resolution traces corresponding to the first pair of IS following an ictal and postictal depression event (blue) are overlayed with the last pair of IS preceding the subsequent ictal event (red). Measurements are indicated for IS amplitude (in microvolts) and interval (in seconds). (B) IS showed a decrease in interval duration from the first IS pair to the last (***p = .008, Student unpaired t‐test, n = 61 mutants and n = 61 wild type) and an increase in amplitude (**p = .0002). (C) Mean IS interval and amplitude for all six developmental epileptic encephalopathy zebrafish mutants. Color represents the percent change. IED, interictal epileptiform discharge.

Figure Data
Acknowledgments
This image is the copyrighted work of the attributed author or publisher, and ZFIN has permission only to display this image to its users. Additional permissions should be obtained from the applicable author or publisher of the image. Full text @ Epilepsia