
IMAGE
FIGURE 2
- ID
- ZDB-IMAGE-260311-597
- Publication
- Whyte-Fagundes et al., 2025 - Zebrafish models of developmental epileptic encephalopathy accurately reflect clinical electrographic biomarkers
- All Figures
- Figures for Whyte-Fagundes et al., 2025
Image
|
Figure Caption
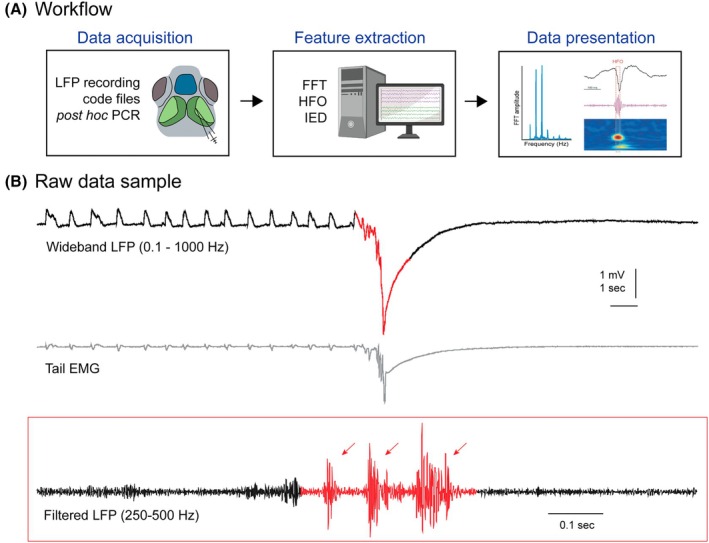
FIGURE 2
Experimental approach. (A) Workflow for acquiring data, extracting electroencephalographic features, and presenting data. (B) Representative wideband local field potential (LFP) trace (top) with associated tail electromyogram (middle) and 200–500‐Hz filtered LFP for high‐frequency oscillation detection indicated by red arrows (bottom). DEE, developmental epileptic encephalopathy. *denotes heterozygote throughout manuscript.
Acknowledgments
This image is the copyrighted work of the attributed author or publisher, and
ZFIN has permission only to display this image to its users.
Additional permissions should be obtained from the applicable author or publisher of the image.
Full text @ Epilepsia