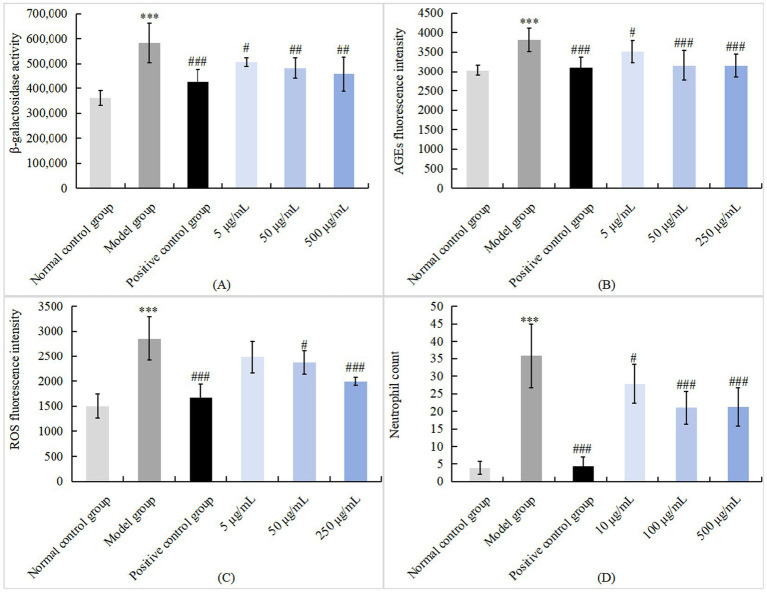
IMAGE

Figure 4

ID
ZDB-IMAGE-260311-160
Source
Figures for Zhang et al., 2026
Image
Figure Caption

Figure 4

Potential oral beauty efficacy data column graph combination. Compared with the normal control group, ***p < 0.001; compared with the model group, #p < 0.05, ##p < 0.01, ###p < 0.001. (A) Anti-aging action, bar chart of blue staining intensity of β-galactosidase; (B) anti-glycation action, AGEs fluorescence intensity bar chart; (C) anti-oxidation action, bar chart of ROS fluorescence signal intensity; (D) anti-inflammatory action, neutrophil count bar chart (chart data are provided in Appendix D).

Acknowledgments
This image is the copyrighted work of the attributed author or publisher, and ZFIN has permission only to display this image to its users. Additional permissions should be obtained from the applicable author or publisher of the image. Full text @ Front Med (Lausanne)