
IMAGE
Fig. 4
- ID
- ZDB-IMAGE-260310-40
- Publication
- Hillman et al., 2025 - Genetic disruption of leucine rich repeat transmembrane protein 4 like 1 induces a pro-social behavioural phenotype in zebrafish
- All Figures
- Figures for Hillman et al., 2025
Image
|
Figure Caption
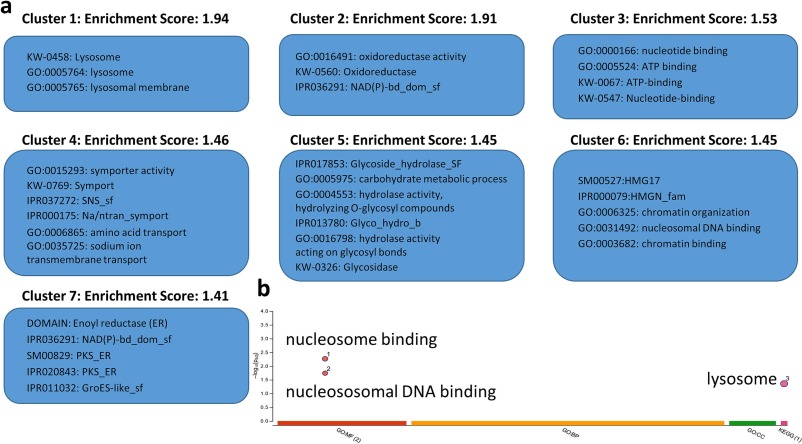
Fig. 4 Pathway enrichment analysis of differentially-expressed genes between lrrtm4l1−/− and lrrtm4l1+/+ zebrafish. (a) Functional annotation clustering using DAVID pathway analysis revealed seven significantly enriched clusters (enrichment score ≥ 1.3). (b) g:profiler functional enrichment analysis revealed enriched GO and KEGG pathways related to nucleosome binding and lysosome. n = 6/group.
Acknowledgments
This image is the copyrighted work of the attributed author or publisher, and
ZFIN has permission only to display this image to its users.
Additional permissions should be obtained from the applicable author or publisher of the image.
Full text @ Neurobiol. Dis.