
Fig. 2 - Supplemental 1
- ID
- ZDB-IMAGE-260217-9
- Publication
- Chiu et al., 2026 - Glial betaPix is essential for blood vessel development in the zebrafish brain
- All Figures
- Figures for Chiu et al., 2026
|
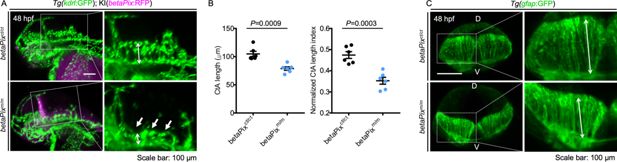
Fig. 2 - Supplemental 1 betaPixm/m mutant had brain hemorrhages, central artery defects, and abnormal glial structure. (A) 3D reconstruction of the vasculature (green) in the heads with lateral view, anterior to left. Endogenous betaPix expression (magenta) is only shown in Cre mRNA-injected mutant embryos. Box areas are shown in higher magnifications of vasculatures at the right panels. Central arteries (CtA) defects (white arrows) were evident in betaPixm/m embryos at 48 hpf. Arrow lines indicating the CtA length. (B) Quantification of CtA parameters in (A). Left panel showing the average CtA length, and right panel showing the CtA length index normalized to individual head length, with each dot representing one embryo. Data are presented in mean ± SEM; unpaired Student’s t-test with individual p-values mentioned in the figure. (C) 3D reconstruction of the glia structure. Box areas showing higher magnifications of glia at the right panels. D, dorsal; V, ventral. Arrow lines indicating the glia length. Individual scale bars are indicated in the figure.