
Fig. 3
- ID
- ZDB-IMAGE-260217-11
- Genes
- Publication
- Chiu et al., 2026 - Glial betaPix is essential for blood vessel development in the zebrafish brain
- All Figures
- Figures for Chiu et al., 2026
|
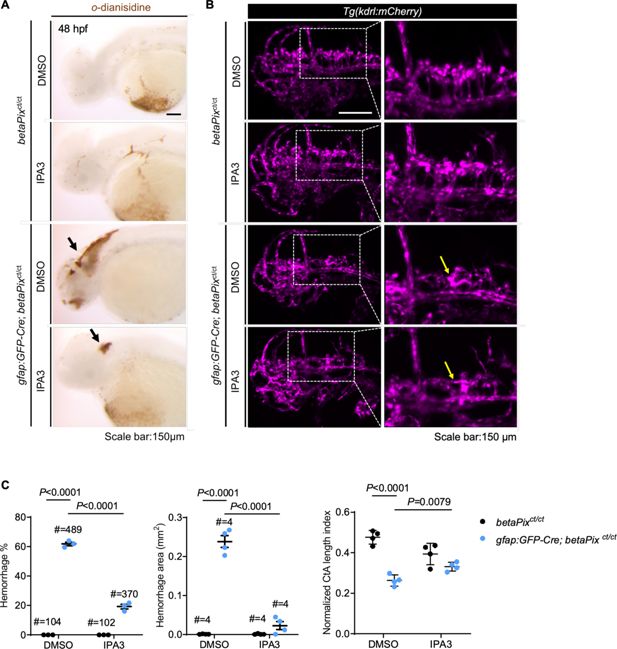
Fig. 3 Glial-specific betaPix knockouts recapture global betaPix mutant phenotypes. (A) Representative stereomicroscopy images of erythrocytes stained with o-dianisidine in betaPixct/ct siblings and gfap:GFP-Cre; betaPixct/ct mutant embryos treated with DMSO or IPA3 at 48 hpf. Brain hemorrhages indicated with arrows in glial-specific betaPix knockouts. Lateral view with anterior to the left. (B) Left panels showing 3D reconstruction of the vasculature (magenta) in the heads at 48 hpf, lateral view with anterior to the left. Box areas are shown in higher magnifications of brain vasculatures at the right panels. CtA defects indicated in yellow arrows in gfap:GFP-Cre; betaPixct/ct mutant embryos. (C) Quantification of brain hemorrhages in (A) and CtA parameters in (B). Left panel showing hemorrhage percentages, with independent experiments as dots. Middle panel showing hemorrhage areas with each dot representing one embryo. # represents the numbers of embryos scored for each analysis, three or more individual experiments conducted. Right panel showing CtA length index normalized to individual head length, with each dot representing one embryo. Data are presented in mean ± SEM; one-way ANOVA with Dunnett’s test, individual p-values mentioned in the figure. Individual scale bars are indicated in the figure.