IMAGE

Fig. 6

ID
ZDB-IMAGE-260210-173
Source
Figures for Gao et al., 2026
Image
Figure Caption

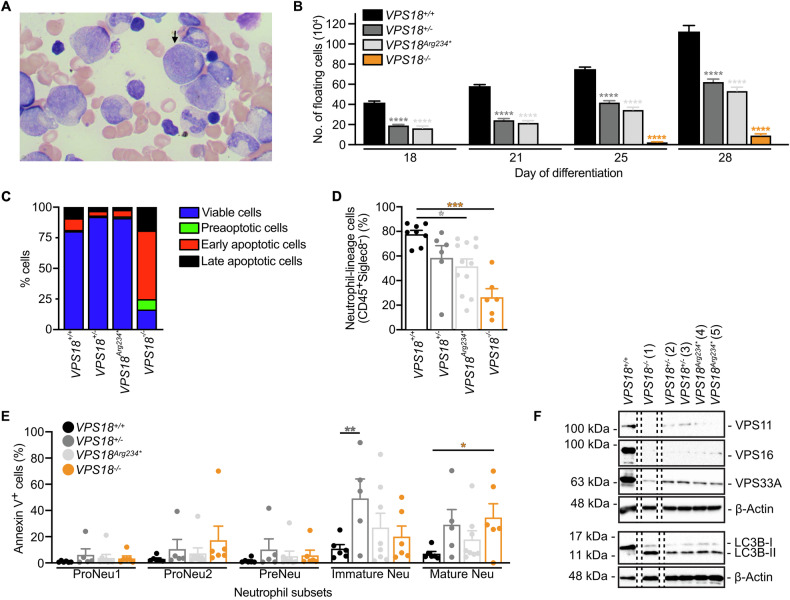
Fig. 6 Patient-specific mutations in iPSC-derived neutrophils recapitulate the patient’s phenotype.

A Microscopy image of the patient’s bone marrow aspiration. Myelocyte, arrow. B Number of floating cells released from 6 iPSC colonies per well at indicated days of differentiation from indicated cell lines. n = 3 technical replicates per cell lines (1 VPS18+/+, 2 VPS18+/-, 2 VPS18Arg234*, 1 VPS18-/- cell lines). Mean ± SEM. ****P < 0.0001 compared to VPS18+/+. C Quantification of viable, preapoptotic, early and late apoptotic cells of indicated genotypes at day 28 of differentiation in % (100%, sum of all detected single cells) analyzed by flow cytometry. n ≥ 1. Data presented as mean. D Quantification of neutrophil-lineage directed cells (CD45+Siglec) from indicated cell lines at day 28 analyzed by flow cytometry. n ≥ 6. Mean ± SEM. *P < 0.05, ***P < 0.001 compared to VPS18+/+. E Annexin V+ cells within populations of proNeu1 (CD11b-, CD49d+, SSC-Alow), proNeu2 (CD11b-, CD49d+, SSC-Ahigh), preNeu (CD49d+, CD101-), immature (CD35+, CD16) and mature (CD35+, CD16+) neutrophils from indicated cell lines at day 28 in % (100%, sum of all single cells) analyzed by flow cytometry. n ≥ 6. Mean ± SEM. *P < 0.05, **P < 0.01 compared to VPS18+/+. F Representative Western blots of VPS11, VPS16 and VPS33A (upper panel) & LC3B expression (lower panel) in cell lysates from indicated cell lines at day 28. β-actin was used as loading control. n = 2. BE Two-way ANOVA, Tukey’s multiple comparisons test.

Acknowledgments
This image is the copyrighted work of the attributed author or publisher, and ZFIN has permission only to display this image to its users. Additional permissions should be obtained from the applicable author or publisher of the image. Full text @ Cell Death Dis.