IMAGE

Fig. 2

ID
ZDB-IMAGE-260210-170
Source
Figures for Gao et al., 2026
Image
Figure Caption

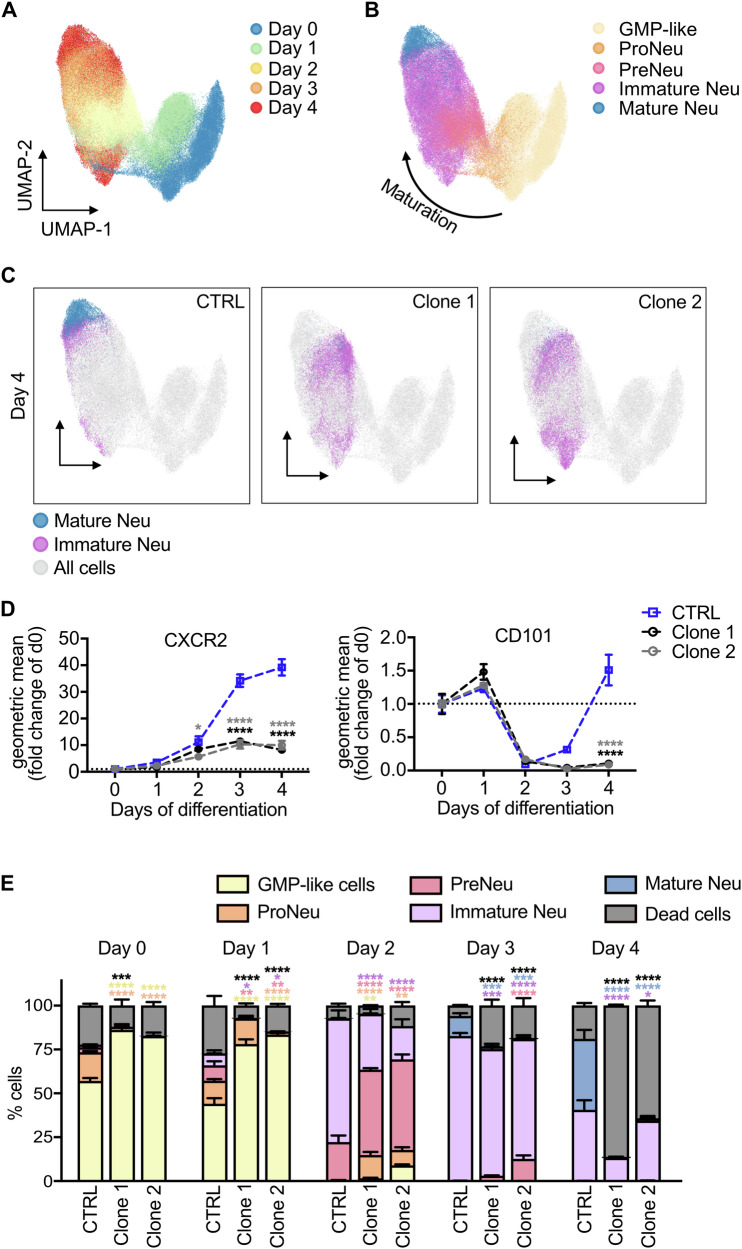
Fig. 2 VPS18-deficient neutrophil progenitors have a late maturation defect.

A, B Spectral flow cytometric analysis followed by dimensional reduction using UMAP of all single, living cells of all analyzed cell lines from all days of differentiation (day 0-4). A Cells were manually gated for the days of differentiation, namely day 0 (blue), day 1 (green), day 2 (yellow), day 3 (orange) and day 4 (red). B Cells were manually gated for the differentiation stages with granulocyte-monocyte progenitor (GMP)-like cells (yellow), neutrophil progenitors (proNeu, orange), neutrophil precursors (preNeu, pink), immature neutrophils (purple) and mature neutrophils (blue). Arrow, direction of maturation. C UMAP analysis of all single, living cells of CTRL, clone 1 and clone 2 cells at day 4. Clusters of mature (blue) and immature neutrophils (magenta) were manually gated and overlaid onto UMAP plot of all cells during neutrophil differentiation (not gated, gray). D Relative expression of CXCR2 and CD101 during differentiation (day 0-4) in indicated cell lines using spectral flow cytometry. Geometric mean as fold change of day (d) 0. n = 4. Mean ± SEM. *P < 0.05, ****P < 0.0001 compared to CTRL. Two-way ANOVA, Tukey’s multiple comparisons test. E Quantification of GMP-like cells, proNeu, preNeu, immature neutrophils, mature neutrophils and dead cells during differentiation from (A, B) of CTRL, clone 1 and clone 2 cells in % (100%, all single cells). n = 4, Mean ± SEM. *P < 0.05, **P < 0.01, ***P < 0.001, ****P < 0.0001 compared to CTRL. Two-way ANOVA, Tukey’s multiple comparisons test.

Acknowledgments
This image is the copyrighted work of the attributed author or publisher, and ZFIN has permission only to display this image to its users. Additional permissions should be obtained from the applicable author or publisher of the image. Full text @ Cell Death Dis.